You are browsing the archive for Spreadsheets.

Data expedition tutorial: UK and US video game magazines

- February 3, 2015 in Data Cleaning, HowTo, Spreadsheets, Storytelling, Workshop Methods, Блог, Интернационален

Data Pipeline

This article is part tutorial, part demonstration of the process I go through to complete a data expedition alone, or as a participant during a School of Data event. Each of the following steps will be detailed: Find, Get, Verify, Clean, Explore, Analyze, Visualize, Publish

Depending on your data, your source or your tools, the order in which you will be going through these steps might be different. But the process is globally the same.


FIND

A data expedition can start from a question (e.g. how polluted are european cities?) or a data set that you want to explore. In this case, I had a question: Has the dynamic of the physical video game magazine market been declining in the past few years ? I have been studying the video game industry for the past few weeks and this is one the many questions that I set myself to answer. Obviously, I thought about many more questions, but it’s generally better to start focused and expand your scope at a later stage of the data expedition.

A search returned Wikipedia as the most comprehensive resource about video game magazines. They even have some contextual info, which will be useful later (context is essential in data analysis).

Screenshot of the Wikipedia table about video game magazines
https://en.wikipedia.org/wiki/List_of_video_game_magazines

GET

The wikipedia data is formatted as a table. Great! Scraping it is as simple as using the importHTML function in Google spreadsheet. I could copy/paste the table, but that would be cumbersome with a big table and the result would have some minor formatting issues. LibreOffice and Excel have similar (but less seamless) web import features.

importHTML asks for 3 variables: the link to the page, the formatting of the data (table or list), and the rank of the table (or the list) in the page. If no rank is indicated, as seen below, it will grab the first one.

Once I got the table, I do two things to help me work quicker:

  • I change the font and cell size to the minimum so I can see more at once
  • I copy everything, then go to Edit→Paste Special→Paste values only. This way, the table is not linked to importHTML anymore, and I can edit it at will.

VERIFY

So, will this data really answer my question completely? I do have the basic data (name, founding data, closure date), but is it comprehensive? A double check with the French wikipedia page about video game magazines reveals that many French magazines are missing from the English list. Most of the magazines represented are from the US and the UK, and probably only the most famous. I will have to take this into account going forward.

CLEAN

Editing your raw data directly is never a good idea. A good practice is to work on a copy or in a nondestructive way – that way, if you make a mistake and you’re not sure where, or want to go back and compare to the original later, it’s much easier. Because I want to keep only the US and UK magazines, I’m going to:

  • rename the original sheet as “Raw Data”
  • make a copy of the sheet and name it “Clean Data”
  • order alphabetically the Clean Data sheet according to the “Country” column
  • delete all the lines corresponding to non-UK or US countries.

Making a copy of your data is important

Tip: to avoid moving your column headers when ordering the data, go to Display→Freeze lines→Freeze 1 line.

Ordering the data to clean it

Some other minor adjustments have to be made, but they’re light enough that I don’t need to use a specialized cleaning tool like Open Refine. Those include:

  • Splitting the lines where 2 countries are listed (e.g. PC Gamer becomes PC Gamer UK and PC Gamer US)
  • Delete the ref column, which adds no information
  • Delete one line where the founding data is missing

EXPLORE

I call “explore” the phase where I start thinking about all the different ways my cleaned data could answer my initial question[1]. Your data story will become much more interesting if you attack the question from several angles.

There are several things that you could look for in your data:

  • Interesting Factoids
  • Changes over time
  • Personal experiences
  • Surprising interactions
  • Revealing comparisons

So what can I do? I can:

  • display the number of magazines in existence for each year, which will show me if there is a decline or not (changes over time)
  • look at the number of magazines created per year, to see if the market is still dynamic (changes over time)

For the purpose of this tutorial, I will focus on the second one, looking at the number of magazines created per year Another tutorial will be dedicated to the first, because it requires a more complex approach due to the formatting of our data.

At this point, I have a lot of other ideas: Can I determine which year produced the most enduring magazines (surprising interactions)? Will there be anything to see if I bring in video game website data for comparison (revealing comparisons)? Which magazines have lasted the longest (interesting factoid)? This is outside of the scope of this tutorial, but those are definitely questions worth exploring. It’s still important to stay focused, but writing them down for later analysis is a good idea.

ANALYSE

Analysing is about applying statistical techniques to the data and question the (usually visual) results.

The quickest way to answer our question “How many magazines have been created each year?” is by using a pivot table.

  1. Select the part of the data that answers the question (columns name and founded)
  2. Go to Data->Pivot Table
  3. In the pivot table sheet, I select the field “Founded” as the column. The founding years are ordered and grouped, allowing us to count the number of magazines for each year starting from the earliest.
  4. I then select the field “Name” as the values. Because the pivot tables expects numbers by default (it tries to apply a SUM operation), nothing shows. To count the number of names associated with each year, the correct operation is COUNTA. I click on SUM and select COUNT A from the drop down menu.

This data can then be visualized with a bar graph.

Video game magazine creation every year since 1981

The trendline seems to show a decline in the dynamic of the market, but it’s not clear enough. Let’s group the years by half-decade and see what happens:

The resulting bar chart is much clearer:

The number of magazines created every half-decade decreases a lot in the lead up to the 2000s. The slump of the 1986-1990 years is perhaps due to a lagging effect of the North american video game crash of 1982-1984

Unlike what we could have assumed, the market is still dynamic, with one magazine founded every year for the last 5 years. That makes for an interesting, nuanced story.

VISUALISE

In this tutorial the initial graphs created during the analysis are enough to tell my story. But if the results of my investigations required a more complex, unusual or interactive visualisation to be clear for my public, or if I wanted to tell the whole story, context included, with one big infographic, it would fall into the “visualise” phase.

PUBLISH

Where to publish is an important question that you have to answer at least once. Maybe the question is already answered for you because you’re part of an organisation. But if you’re not, and you don’t already have a website, the answer can be more complex. Medium, a trendy publishing platform, only allows images at this point. WordPress might be too much for your need. It’s possible to customize the Javascript of tumblr posts, so it’s a solution. Using a combination of Github Pages and Jekyll, for the more technically inclined, is another. If a light database is needed, take a look at tabletop.js, which allows you to use a google spreadsheet as a quasi-database.


Any data expedition, of any size or complexity, can be approached with this process. Following it helps avoiding getting lost in the data. More often than not, there will be a need to get and analyze more data to make sense of the initial data, but it’s just a matter of looping the process.

[1] I formalized the “explore” part of my process after reading the excellent blog from MIT alumni Rahoul Bhargava http://datatherapy.wordpress.com

Flattr this!

Breaking the Knowledge Barrier: The #OpenData Party in Northern Nigeria

- October 1, 2014 in Community, Data Expeditions, Data for CSOs, Events, Follow the Money, Geocoding, Mapping, Spreadsheets, Storytelling, Uncategorized, Visualisation

If the only news you have been watching or listening to about Northern Nigeria is of the Boko Haram violence in that region of Nigeria, then you need to know that other news exist, like the non-government organizations and media, that are interested in using the state and federal government budget data in monitoring service delivery, and making sure funds promised by government reach the community it was meant for.

This time around, the #OpenData party moved from the Nigeria Capital – Abuja to Gusau, Zamfara and was held at the Zamfara Zakat and Endowment Board Hall between September Thursday, 25 and Friday, 26, 2014. With 40 participant all set for this budget data expedition, participants included the state Budget Monitoring Group (A coalition of NGOs in Zamfara) coordinated by the DFID (Development for International Development) State Accountability and Voice Initiative (SAVI),other international NGOs such as Society for Family Health (SFH), Save the Children, amongst others.

IMAG1553

Group picture of participants at the #OpenData Party in Zamfara

But how do you teach data and its use in a less-technology savvy region? We had to de-mystify teaching data to this community, by engaging in traditional visualization and scraping – which means the use of paper artworks in visualizing the data we already made available on the Education Budget Tracker. “I never believed we could visualize the education budget data of the federal government as easy as what was on the wall” exclaimed Ahmed Ibrahim of SAVI

IMAG1516

Visualization of the Education Budget for Federal Schools in Zamfara

As budgets have become a holy grail especially with state government in Nigeria, of most importance to the participants on the first day, was how to find budget data, and processes involved in tracking if services were really delivered, as promised in the budget. Finding the budget data of the state has been a little bit hectic, but with much advocacy, the government has been able to release dataset on the education and health sector. So what have been the challenges of the NGOs in tracking or using this data, as they have been engaged in budget tracking for a while now?

Challenges of Budget Tracking Highlighted by participants

Challenges of Budget Tracking Highlighted by participants

“Well, it is important to note that getting the government to release the data took us some time and rigorous advocacy, added to the fact that we ourselves needed training on analysis, and telling stories out of the budget data” explained Joels Terks Abaver of the Christian Association of Non Indigenes. During one of the break out session, access to budget information and training on how to use this budget data became a prominent challenge in the resolution of the several groups.

The second day took participants through the data pipelines, while running an expedition on the available education and health sector budget data that was presented on the first day. Alas! We found out a big challenge on this budget data – it was not location specific! How does one track a budget data that does not answer the question of where? When involved in budget tracking, it is important to have a description data that states where exactly the funds will go. An example is Construction of Borehole water pump in Kaura Namoda LGA Primary School, or we include the budget of Kaura Namoda LGA Primary School as a subtitle in the budget document.

Taking participants through the data pipelines and how it relates to the Monitoring and Evaluation System

Taking participants through the data pipelines and how it relates to the Monitoring and Evaluation System

In communities like this, it is important to note that soft skills are needed to be taught – , like having 80% of the participants not knowing why excel spreadsheets are been used for budget data; like 70% of participants not knowing there is a Google spreadsheet that works like Microsoft Excel; like all participants not even knowing where to get the Nigeria Budget data and not knowing what Open Data means. Well moving through the school of data through the Open Data Party in this part of the world, as changed that notion.”It was an interesting and educative 2-day event taking us through the budget cycle and how budget data relates to tracking” Babangida Ummar, the Chairman of the Budget Working Group said.

Going forward, this group of NGO and journalist has decided to join trusted sources that will be monitoring service delivery of four education institutions in the state, using the Education Budget Tracker. It was an exciting 2-day as we now hope to have a monthly engagement with this working group, as a renewed effort in ensuring service delivery in the education sector. Wondering where the next data party will happen? We are going to the South – South of Nigeria in the month of October – Calabar to be precise, and on the last day of the month, we will be rocking Abuja!

Flattr this!

Data Playlists

- September 25, 2014 in HowTo, Spreadsheets

Finding ways to learn new ways to play and work with data is always a challenge. Workshops, courses, and sprints are always a really great way to learn from people, and at the School of Data Fellow are doing that all over the world. In India there are lots of languages, different levels of literacy and technology adaption so we want experiment with different ways of sharing data skills.  It can be difficult put on a workshop or do a course, so we thought let’s start creating videos that can be accessed by people . It was important that the videos be easy to replicate and bite size, and that the format was flexible enough to accommodate different ways of teaching.  So we and others can experiment with different types of videos.

So instead of a single 10 minute video on how to use Excel we are asking people to create playlists of videos that are between 2 to 5 minutes long that are one concept or process presented i neach video.

Our first video is about formatting in Excel:

Don’t like excel? Do one for Open Spreadsheets or Fusion Tables.  English is not useful for your audience? Translate each video or put in subtitles, or do your own version. Have a new way to do this same skill? Create a 2 minute video and we can add it to the playlist.  Sharing your favorite tools and tricks for working with data is the main goal of this project.

If you want to do one there a few rules:

  1. Introduce yourself
  2. Break up the lesson by technique and make each video no more than 2 to 5 minutes.
  3. Make sure they are a playlist.
  4. Upload them to youtube and tag them DataMeet and School of Data
  5. Let us know!

If you have any feedback or a video request please feel free to leave it in the comments. We will hopefully release 2 playlists every month.

Adapting from post on DataMeet.org

Flattr this!

A Weekend of Data, Hacks and Maps in Nigeria

- September 16, 2014 in charity data, Data Cleaning, Data Expeditions, event, Mapping, maps, School_Of_Data, Spreadsheets, Visualisation

It was another weekend of hacking for good all around the world, and Abuja, Nigeria was not left out of the weekend of good, as 30 participants gathered at the Indigo Trust funded space of Connected Development [CODE] on 12 – 14 September, scraping datasets, brainstorming creating technology for good, and not leaving one thing out – talking soccer (because it was a weekend, and Nigeria “techies” love soccer especially the English premiership).

Participants at the Hack4Good 2014 in Nigeria

Participants at the Hack4Good 2014 in Nigeria

Leading the team, was Dimgba Kalu (Software Architect with Integrated Business Network and founder TechNigeria), who kick started the 3 day event that was built around 12 coders with other 18 participants that worked on the Climate Change adaptation stream of this year #Hack4Good. So what data did we explore and what was hacked over the weekend in Nigeria? Three streams were worked :

  1. Creating a satellite imagery tagging/tasking system that can help the National Space Research Development Agency deploy micromappers to tag satellite imageries from the NigeriaSat1 and NigeriaSat2
  2. Creating an i-reporting system that allows citizen reporting during disasters to Nigeria Emergency Management Agency
  3. Creating an application that allows citizens know the next water point and its quality within their community and using the newly released dataset from the Nigeria Millennium Development Goal Information System on water points in the country.

Looking at the three systems that was proposed to be developed by the 12 coders, one thing stands out, that in Nigeria application developers still find it difficult to produce apps that can engage citizens – a particular reason being that Nigerians communicate easily through the radio, followed by SMS as it was confirmed while I did a survey during the data exploration session.

Coders Hackspace

Coders Hackspace

Going forward, all participants agreed that incorporating the above medium (Radio and SMS) and making games out of these application could arouse the interest of users in Nigeria.  “It doesn’t mean that Nigerian users are not interested in mobile apps, what we as developers need is to make our apps more interesting” confirmed Jeremiah Ageni, a participant.

The three days event started with the cleaning of the water points data, while going through the data pipelines, allowing the participants to understand how these pipelines relates to mapping and hacking. While the 12 hackers were drawn into groups, the second day saw thorough hacking – into datasets and maps! Some hours into the second day, it became clear that the first task wouldn’t be achievable; so much energy should be channelled towards the second and third task.

SchoolofData Fellow - Oludotun Babayemi taking on the Data Exploration session

SchoolofData Fellow – Oludotun Babayemi taking on the Data Exploration session

Hacking could be fun at times, when some other side attractions and talks come up – Manchester United winning big (there was a coder, that was checking every minutes and announcing scores)  , old laptops breaking (seems coders in Abuja have old  ones), coffee and tea running out (seems we ran out of coffee, like it was a sprint), failing operating systems (interestingly, no coders in the house had a Mac operating system), fear of power outage (all thanks to the power authority – we had 70 hours of uninterrupted power supply) , and no encouragement from the opposite sex (there was only two ladies that strolled into the hack space).

Bring on the energy to the hackspace

Bring on the energy to the hackspace

As the weekend drew to a close, coders were finalizing and preparing to show their great works.  A demo and prototype of streams 2 and 3 were produced. The first team (working on stream 2), that won the hackathon developed EMERGY, an application that allows citizens to send geo-referenced reports disasters such as floods, oil spills, deforestation to the National Emergency Management Agency of Nigeria, and also create a situation awareness on disaster tagged/prone communities, while the second team, working on stream 3, developed KNOW YOUR WATER POINT an application that gives a geo-referenced position of water points in the country. It allows communities; emergency managers and international aid organizations know the next community where there is a water source, the type, and the condition of the water source.

(The winning team of the Hack4Good Nigeria) From Left -Ben; Manga; SchoolofData Fellow -Oludotun Babayemi; Habib; Chief Executive, CODE - Hamzat

(The winning team of the Hack4Good Nigeria) From Left -Ben; Manga; SchoolofData Fellow -Oludotun Babayemi; Habib; Chief Executive, CODE – Hamzat

Living with coders all through the weekend, was mind blowing, and these results and outputs would not be scaled without its challenges. “Bringing our EMERGY application live as an application that cuts across several platforms such as java that allows it to work on feature phones can be time consuming and needs financial and ideology support” said Manga, leader of the first team. Perhaps, if you want to code, do endeavour to code for good!


Flattr this!

WhatDoTheyKnow Team Urge Caution When Using Excel to Depersonalise Data

- June 17, 2014 in Community, Data Cleaning, HowTo, Spreadsheets

[Guest Cross-post: from Myfanway Nixon of mySociety. You can learn more about her on her blog. The original post can be found here. Thanks for sharing!]

mySociety’s Freedom of Information website WhatDoTheyKnow is used to make around 15 to 20% of FOI requests to central government departments and in total over 160,000 FOI requests have been made via the site. wdtklogo

Occasionally, in a very small fraction of cases, public bodies accidentally release information in response to a FOI request which they intended to withhold. This has been happening for some time and there have been various ways in which public bodies have made errors. We have recently, though, come across a type of mistake public bodies have been making which we find particularly concerning as it has been leading to large accidental releases of personal information.

What we believe happens is that when officers within public bodies attempt to prepare information for release using Microsoft Excel, they import personally identifiable information and an attempt is made to summarise it in anonymous form, often using pivot tables or charts.

What those working in public bodies have been failing to appreciate is that while they may have hidden the original source data from their view, once they have produced a summary it is often still present in the Excel workbook and can easily be accessed. When pivot tables are used, a cached copy of the data will remain, even when the source data appears to have been deleted from the workbook.

When we say the information can easily be accessed, we don’t mean by a computing genius but that it can be accessed by a regular user of Excel.

We have seen a variety of public bodies, including councils, the police, and parts of the NHS, accidentally release personal information in this way. While the problem is clearly the responsibility of the public bodies, it does concern us because some of the material ends up on our website (it often ends up on public bodies’ own FOI disclosure logs too).

We strive to run the WhatDoTheyKnow.com website in a responsible manner and promptly take down inappropriately released personal information from our website when our attention is drawn to it. There’s a button on every request thread for reporting it to the site’s administrators.

As well as publishing this blog post in an effort to alert public bodies to the problem, and encourage them to tighten up their procedures, we’ve previously drawn attention to the issue of data in “hidden” tabs on Excel spreadsheets in our statement following an accidental release by Islington council; one of our volunteers has raised the issue at a training event for police FOI officers, and we’ve also been in direct contact with the Information Commissioner’s office both in relation to specific cases, and trying to help them understand the extent of the problem more generally.

Advice

Some of our suggestions:

  • Don’t release Excel pivot tables created from spreadsheets containing personal information, as the source data is likely to be still present in the Excel file.
  • Ensure those within an organisation who are responsible for anonymising data for release have the technical competence to fulfil their roles.
  • Check the file sizes. If a file is a lot bigger than it ought to be, it could be that there are thousands of rows of data still present in it that you don’t want to release.
  • Consider preparing information in a plain text format, eg. CSV, so you can review the contents of the file before release.

Flattr this!

SQL: The Prequel (Excel vs. Databases)

- November 7, 2013 in HowTo, Spreadsheets, SQL

Table à encrer les rouleaux d’imprimerie

Image credit: Frédéric Bisson

School of Data is re-publishing Noah Veltman‘s Learning Lunches, a series of tutorials that demystify technical subjects relevant to the data journalism newsroom.

This first Learning Lunch is about the database query language SQL and how it compares to Excel.

What Excel is good at

Excel gets a bad rap. It’s a very flexible, powerful piece of software that’s good at a lot of things.

  • It’s easy to browse data.
  • It’s easy to manually enter and edit data.
  • It’s easy to share copies of files.
  • You have fine control over visual presentation.
  • It has a very flexible structure. Every cell is a unique snowflake.
  • It integrates with other popular office software.
  • Formulas make it a living document.
  • It has a built-in suite of helpers for charts, comments, spellchecking, etc.
  • It’s relatively easy to learn.

What Excel is bad at

Unfortunately Excel also has its limits. It’s pretty bad at some other things.

  • It lacks data integrity. Because every cell is a unique snowflake, things can get very inconsistent. What you see doesn’t necessarily represent the underlying data. A number is not necessarily a number. Data is not necessarily data. Excel tries to make educated guesses about you want, and sometimes it’s wrong.
  • It’s not very good for working with multiple datasets in combination.
  • It’s not very good for answering detailed questions with your data.
  • It doesn’t scale. As the amount of data increases, performance suffers, and the visual interface becomes a liability instead of a benefit. It also has fixed limits on how big a spreadsheet and its cells can be.
  • Collaborating is hard. It’s hard to control versions and have a “master” set of data, especially when many people are working on the same project (Google Spreadsheets fix some of this).

Enter relational databases

What is a relational database? We could get very picky about terminology, but let’s not. Broadly speaking, it consists of a “server” that stores all your data (think of a huge library) and a mechanism for querying it (think of a reference librarian).

The querying is where SQL comes in, emphasis on the Q. SQL stands for Structured Query Language, and it is a syntax for requesting things from the database. It’s the language the reference librarian speaks. More on this later.

The “relational” part is a hint that these databases care about relationships between data. And yes, there are non-relational databases, but let’s keep this simple. We’re all friends here.

The database mantra

Everything in its proper place.

A database encourages you to store things logically. Sometimes it forces you to.

Every database consists of tables. Think of a table like a single worksheet in an Excel file, except with more ground rules. A database table consists of columns and rows.

Columns

Every column is given a name (like ‘Address’) and a defined column type (like ‘Integer,’ ‘Date’, ‘Date+Time’, or ‘Text’). You have to pick a column type, and it stays the same for every row. The database will coerce all the data you put in to that type. This sounds annoying but is very helpful. If you try to put the wrong kind of data in a column, it will get upset. This tells you that there’s a problem with your data, your understanding of the data, or both. Excel would just let you continue being wrong until it comes back to bite you.

You can also specify helpful things like…
… whether a column can have duplicate values.
… whether a column can be empty.
… the default value for a column if you don’t specify one.

Columns define the structure of your data.

Rows

Rows are the actual data in the table. Once you establish the column structure, you can add in as many rows as you like.

Every row has a value for every column. Excel is a visual canvas and will allow you to create any intricate quilt of irregular and merged cells you’d like. You can make Tetris shapes and put a legend in the corner and footnotes at the bottom, all sharing the same cells.

This won’t fly with a database. A database table expects an actual grid. It’s OK for cells to be empty, but to a computer intentionally empty is not the same as nonexistent.

Multiple tables, joins, and keys

More on this later, but part of putting everything in its proper place means making it easy to break up your data into several tables for different data categories and work with them as a set.

Let data be data.

A database focuses only on the data layer of things and ignores visual presentation. Colors, fonts, borders, date formatting, and number formatting basically don’t exist. What you see is mostly what you get. That’s good news and bad news: it means that a database is usually really good at what it does do, but it also often needs to be paired with other things in order to create a final product, like a chart or a web page. A database is designed to plug in to other things. This extra step is one of the things that turns a lot of people off to databases.

By being really good at data storage and processing and not at other things, databases are extremely scaleable. 1 million rows of data? 10 million? No problem. For newsroom purposes, there’s virtually no upper limit to how much data you can store or how complicated you can make your queries.

Databases & the web

Databases are great for preliminary analysis, exploration, and data cleaning. But they’re even better for connecting to something else once you know what you want to do with the data. Virtually every web application is powered by databases like this. When you log in somewhere, it’s checking your username and password against a database. When you go to IMDB and click on a movie, it’s looking up a database. Twitter, Facebook, Gmail, it’s databases all the way down.

When it comes to news features, a database usually gets involved when the amount of data is large or it is expected to change over time. Rather than having a static JSON file with your data, you keep a database and you write an app that queries the database for the current data. Then, when the data changes, all you have to do is update the database and the changes will be reflected in the app. For one-off apps where the data is not going to change and the amount is small, a database is usually overkill, although you may still use one in the early stages to generate a data file of some sort.

If you’re using an API to feed current data into an app instead, you’re still using a database, you’re just letting someone else host it for you. This is much easier, but also poses risks because you access the data at their pleasure.

Potential semantic quibble: sometimes an app isn’t directly accessing a database to fetch information. Sometimes it’s accessing cached files instead, but those cached files are generated automatically based on what’s in the database. Tomato, Tomahto.

So when should I use a database instead of Excel?

Excel and databases are good for very different things. Neither is per se good or bad. A rule of thumb: you should strongly consider using a database for a project to the extent that the following are true:

  • You have a lot of data.
  • Your data is messy or complex.
  • You want to power something else with your data.
  • Other people need to work with the same data.

OK, I’m intrigued. How do I get started?

Because databases have a learning curve, it makes sense not to dive in too deep right away. Start off using it only in cases where the advantage is especially strong and your needs are pretty simple. As your comfort level increases, you’ll increasingly look towards databases to get what you want faster.

Option 1: SQLite

SQLite is a good way to get started. You can install the “SQLite Manager” add-on for Firefox and do everything within the browser.

A SQL tutorial based on SQLite: https://github.com/tthibo/SQL-Tutorial

Option 2: Microsoft Access

Microsoft Access runs on SQL and presents a more traditional desktop software interface. Depending on who you ask, it’s either a helpful tool or just makes things more confusing. I wouldn’t personally recommend it, but your mileage may vary.

Option 3: Set up a shared web hosting account

You can set up a shared web hosting account as a sandbox to play with this. This can cost as little as £20 a year. These accounts typically come with an interface to let you create, edit, and interact with databases without writing any SQL. They also give you a place to play around with any other web-related skills you’re interested in and share the results with others!

A Small Orange (a good, cheap hosting option): http://asmallorange.com/

Option 4: Install MySQL or PostgreSQL on your computer

You can install MAMP on a Mac or WAMP on a Windows PC. This will install MySQL as well as a great web-based interface called phpMyAdmin (http://www.phpmyadmin.net). Once you have MySQL installed, you have lots of additional options for free software to serve as a browser/editor for your SQL databases. If you prefer you can install PostgreSQL instead, a slightly different database flavor (there are many different flavors of database but MySQL and PostgreSQL are two popular ones with lots of documentation, don’t overthink it for now).


Appendix: querying for fun and profit

Much of the power of relational databases comes from SQL, a very flexible language for asking a database questions or giving it orders. The learning curve is steeper than Excel, but once you get the hang of it you can quickly answer almost any question about your data. Let’s go through some brief examples of how a desired action looks in SQL.

The basic building blocks of SQL are four verbs: SELECT (look up something), UPDATE (change some existing rows), INSERT (add some new rows), DELETE (delete some rows). There are many other verbs but you will use these the most, especially SELECT.

Let’s imagine a table called athletes of Olympic athletes with six columns:

name
country
birthdate
height
weight
gender

When creating our table, we might also specify things like “country can be empty” or “gender must be either M or F.”

Query 1: Get a list of all the athletes in alphabetical order. This will show you the entire table, sorted by name from A-Z.

SELECT
*
FROM athletes
ORDER BY name ASC

Query 2: Get a list of all the athletes on Team GB. This will show you only the rows for British athletes. You didn’t specify how to sort it, so you can’t count on it coming back in the order you want.

SELECT
*
FROM athletes
WHERE country = 'Great Britain'

Query 3: What country is the heaviest on average? This will take all the rows and put them into groups by country. It will show you a list of country names and the average weight for each group.

SELECT
country,AVG(WEIGHT)
FROM athletes
GROUP BY country

Query 4: What birth month produces the most Olympic athletes? Maybe you want to test an astrological theory about Leos being great athletes. This will show you how many Olympic athletes were born in each month.

SELECT
MONTHNAME(birthdate),COUNT(*)
FROM athletes
GROUP BY MONTHNAME(birthdate)

Query 5: Add a new athlete to the table. To insert a row, you specify the columns you’re adding (because you don’t necessarily need to add all of them every time), and the value for each.

INSERT
INTO athletes
(name,country,height,weight,gender)
VALUES ('Andrew Leimdorfer','Great Britain',180,74.8,'M')

Query 6: Get all male athletes in order of height:weight ratio. Maybe you would notice something strange about Canadian sprinter Ian Warner.

SELECT
*
FROM athletes
WHERE gender = 'M'
ORDER BY height/weight ASC

Query 7: If you got your data from london2012.com, you would think 5′ 7″ Ian Warner was 160 kg, because his weight was probably entered in lbs instead. Let’s fix that by UPDATEing his row.

UPDATE
athletes
SET weight = weight/2.2
WHERE NAME = 'Ian Warner'

Query 8: Delete all the American and Canadian athletes, those jerks.

DELETE
FROM athletes
WHERE country = 'United States of America' OR country = 'Canada';

Once you look at enough queries you’ll see that a query is like a sentence with a grammar. It has a “verb” (what kind of action do I want?), an “object” (what tables do I want to do the action to?), and optional “adverbs” (how specifically do I want to do the action?). The “adverbs” include details like “sort by this column” and “only do this for certain rows.”

Bonus Level: multiple tables and a brief taste of JOINs

You probably have a lot more data than just athletes. For each country, you might also have its flag, its population, and its capital city. You also have all the Olympic events, which athletes participated in them, which venues they were at, which sport category they belong to. For each event, you also end up with results: who got which medals, and in some cases what the finishing times/scores were.

The typical Excel approach to this is one of two forms of madness: either you have a bunch of spreadsheets and painstakingly cross-reference them, or you have one mega-spreadsheet with every column (government data sources love mega-spreadsheets).

You might have a spreadsheet where each row is an athlete, and then you have a long list of columns including lots of redundant and awkwardly-stored information, like:

name, country, birthdate, height, weight, gender, country_population, country_flag_url, country_gdp, event1, event1_date, event1_result, event2_date, event2_result, event3_date, event3_result, event4_date, event4_result, number_of_medals

This mega-spreadsheet approach has all kinds of weaknesses:

  • You lose the benefit of visually browsing the information once a table gets this big. It’s a mess.
  • This structure is very inflexible. The law of mega-spreadsheets states that once you arbitrarily define n columns as the maximum number of instances a row could need, something will need n+1.
  • It has no sense of relationships. Athletes are one atomic unit here, but there are others. You have countries, you have events (which belong to sports), you have results (which belong to events), you have athletes (which compete in events, have results in those events, and almost always belong to countries). These relationships will probably be the basis for lots of interesting stories in your data, and the mega-spreadsheet does a poor job of accounting for them.
  • Analysis is difficult. How do you find all the athletes in the men’s 100m dash? Some of them might have their time in event1_result, some of them might have it in event2_result. Have fun with those nested IF() statements! And if any of this data is manually entered, there’s a good chance you’ll get textual inconsistencies between things like “Men’s 100m,” “Men’s 100 meter,” and “100m.”

SQL lets you keep these things in a bunch of separate tables but use logical connections between them to smoothly treat them as one big set of data. To combine tables like this, you use what are called JOINs. In a single sentence: a JOIN takes two tables and overlaps them to connect rows from each table into a single row. JOINs are beyond the scope of this primer, but they are one of the things that make databases great, so a brief example is in order.

You might create a table for athletes with basic info like height & weight, a table for events with details about where and when it takes place and the current world record, a table for countries with information about each country, and a table for results where each row contains an athlete, an event, their result, and what medal they earned (if any). Then you use joins to temporarily combine multiple tables in a query.

Who won gold medals today?

SELECT
athletes.name, athletes.country, event.name
FROM athletes, results, events
WHERE athletes.id = results.athlete_id AND event.id = results.event_id
AND event.date = DATE(NOW()) AND results.medal = 'Gold'

How many medals does each country have?

SELECT
countries.name, COUNT(*)
FROM athletes, countries, results, events
WHERE athletes.id = results.athlete_id AND event.id = results.event_id AND athletes.country_id = countries.id
AND results.medal IN ('Gold','Silver','Bronze')
GROUP BY countries.id

Flattr this!

Asking Questions of Data – Garment Factories Data Expedition

- May 24, 2013 in Spreadsheets, SQL

As preparation for the upcoming data expedition on Mapping the garment factories this weekend, several intrepid explorers have been collating data from brand supplier lists that identify the location of over 3,000 factories to date.

The data is being published via a Google Spreadsheet, which means we can also treat it as a database, asking database like queries either within the spreadsheet itself, or via a webservice.

The School of Data blogpost Asking Questions of Data – Some Simple One-Liners introduced the idea of using SQL – the Structured Query Language – to ask questions of a dataset contained in a small database populated with data that had been “liberated” using Scraperwiki. The query language that Google Spreadsheets supports is rather like a cut down version of SQL, so it can be a good place to start learning how to write such queries.

The query language allows us to select just those databasespreadsheet rows where a particular column contains a particular value, such as rows relating to factories located in a particular country or supplying a particular brand. We can also create more complex queries, for example identifying factories located in a particular country that supply a particular brand. We can also generate summary reports, such as listing all the brands identified, or counting all the factories within each city in a particular country.

I’ve posted an informal, minimal interface to the query API here: Google Spreadsheet Query Interface (feel free to clone the view and improve on it!)

spreadsheet explorer config

Paste in the spreadsheet key value, which for the garment factory spreadsheet is 0AvdkMlz2NopEdEdIZ3d4VlFJQ0NkazhrWGFQdXZQMkE, along with the sheet’s “gid” value – 0 for the sheet we want. If you click on the Preview button, we can see the column headings:

spreadsheet query preview headings

We can now start to ask questions of the data, building up a query around the different spreadsheet columns. For convenience (?!), we can use the letters that identify each column in the spreadsheet to help build up out query.

google spreadsheet query form

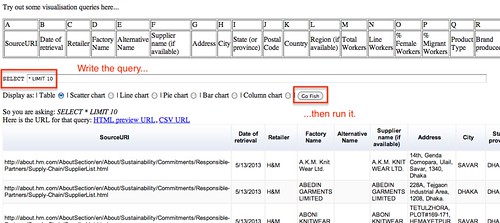
Let’s start with a simple query that shows all the columns (*) for the first 10 rows (LIMIT 10)

We would write the query out in full as:

SELECT * LIMIT 10

but the form handles the initial SELECT statement for us, so all we need to write is:

* LIMIT 10

Run the query by clicking ion the “Go Fish” button, and the results should appear in a table.

run a query

Note that you can sort the rows in the table by clicking on the appropriate column header. The query form also allows you to preview queries using a variety of charts, although for these to work you will need to make sure you select appropriate columns as we’ll see later.

As well as generating a tabular (or chart based) view of the results, the running the query also generates couple of links, one to an HTML table view of the results, one to a CSV formatted version of the data.

csv and html output links

If you look at the web addresses/URLs that are generated for these links, you may notice they are “hackable” (Hunting for Data – Learning How to Read and Write Web Addresses, aka URLs ).

Knowing that the spreadsheet provides us with database functionality allows us to do two different things. Firstly, we can run queries on the data to generate subsets of it, for example as CSV files, that we can load into other tools for analysis purposes. Secondly, we can generate reports on the data that may themselves be informative. Let’s look at each in turn.

Generating subsets of data

In the simplest case, there are two main ways we can generate subsets of data. If you look at the column headings, you will notice that we have separate columns for different aspects of the dataset, such as the factory name, the company it supplies, the country or city it is based in, and so on. Not all the separate factory results (that is, the separate rows of data) have data in each column, which is something we may need to be aware of!)

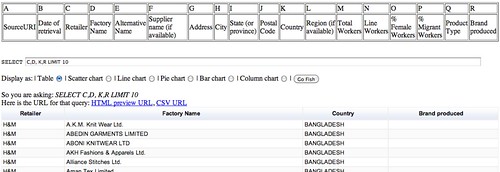
In some reports, we may not want to see all the columns, so instead we can select just those columns we want:

SELECT C, D, K,R LIMIT 10

simple select

To see all the results, remove the LIMIT 10 part of the query.

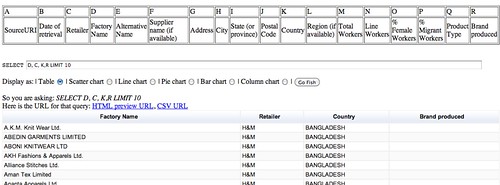
We can also rearrange the order of columns by changing the order in which they appear in the query:

SELECT D, C, K, R LIMIT 10

reorder columns

The second form of subsetting we can do is to limit the rows that are displayed dependent on whether they contain a particular value, or more specifically, when the value of a cell from that row contains a particular value in a particular column.

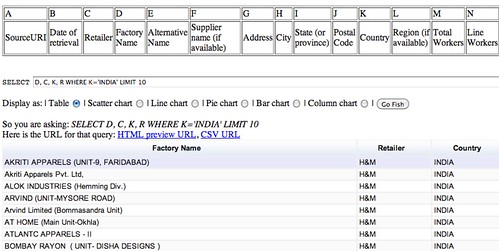
So for example, here’s a glimpse of some of the factories that are located in India:

SELECT D, C, K, R WHERE K='INDIA' LIMIT 10

some Indian factories

To see all the countries that are referenced, some query languages allow us to use a DISTINCT search limit. The Google Query Language does not support the DISTINCT operator, but we can find another way of getting all the unique values contained within a column using the GROUP BY operator. GROUP BY says “find all the elements in a column that have the same value, and for each of these groups, do something with it”. The something-we-can do might simply be to count the number of the rows in the group, we which can do as follows (COUNTing on any column other than the GROUP BY column(s) will do).

SELECT K, COUNT(A) GROUP BY K LIMIT 10

finesse distinct

See if you can work out how to find the different Retailers represented in the dataset. Can you also see how to find the different retailers represented in a particular country?

One of the things you may notice from the above result is that “ARGENTINA” and “Argentina” are not the same, and neither are ‘BANGLADESH’ and ‘Bangladesh’…

If we wanted to search for all the suppliers listed in that country, we could do a couple of things:

  • SELECT C, K WHERE K='BANGLADESH' OR K='Bangladesh' – in this case, we accepts results where the Country column value for a given row is either “BANGLADESH” or it is “Bangladesh”.

  • SELECT C, K WHERE UPPER(K)='BANGLADESH' – in this case, we set the cell value to its uppercase equivalent, and then test to see if it matches ‘BANGLADESH’

In a certain sense, the latter query style is applying an element of data cleansing to the data as it runs the query.

Creating Simple Reports

Sticking with Bangladesh for a while, let’s see how many different factories each of the different retailers appears to have in that country.

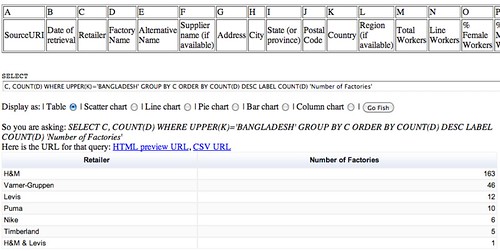
SELECT C, COUNT(D) WHERE UPPER(K)='BANGLADESH' GROUP BY C

simple report

That works okay-ish, but we could tidy the results up little. We could sort the results by clicking on the count column header in the table, but we could also the the ORDER BY query limit to order the results (ASC for ascending order, DESC for descending). We can also change the LABEL that appears in the calculated column heading.

SELECT C, COUNT(D) WHERE UPPER(K)='BANGLADESH' GROUP BY C ORDER BY COUNT(D) DESC LABEL COUNT(D) 'Number of Factories'

tidied report

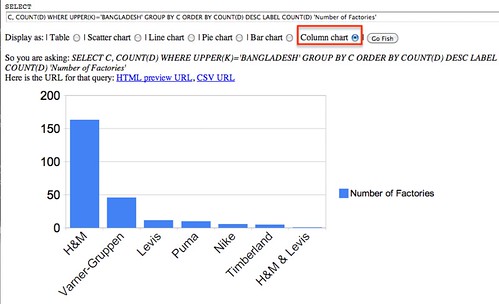
As well as viewing the results of the query as a table, if the data is in the right form, we may be able to get a chart view of it.

chart preview

Remember, running the query also generates links to HTML table or CSV versions of the resulting data set.

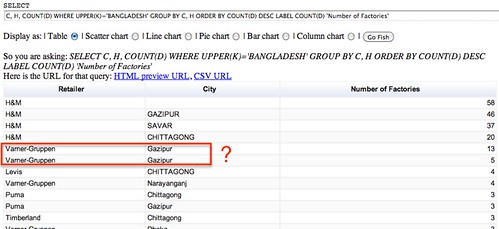
As you get more confident writing queries, you might find they increase in complexity. For example, in Bangladesh, how many factories are on the supplier list of each manufacturer in each City?

SELECT C, H, COUNT(D) WHERE UPPER(K)='BANGLADESH' GROUP BY C, H ORDER BY COUNT(D) DESC LABEL COUNT(D) 'Number of Factories'

data cleaning issue

Note that as we ask these more complicated queries – as in this case, where we are grouping by two elements (the supplier and the city) – we start stressing the data more; and as we stress the data more, we may start to find more areas where we may have data quality issues, or where further cleaning of the data is required.

In the above case, we might want to probe why there are two sets of results for Varner-Gruppen in Gazipur?

SELECT C, H, D WHERE UPPER(K)='BANGLADESH' AND C='Varner-Gruppen' AND H = "Gazipur"

data cleansing issue?

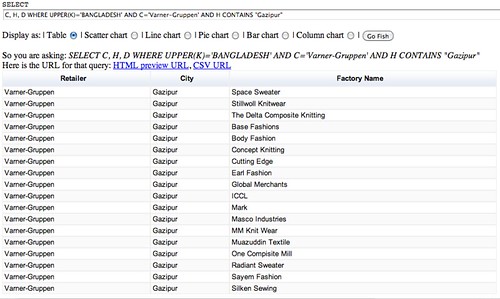
Hmm… only five results? maybe some of the cells actually contain white space as well as the city name? We can get around this by looking not for an exact string match on the city name, but instead looking to see if the cell value in the spreadsheet CONTAINS the search string we are looking for:

SELECT C, H, D WHERE UPPER(K)='BANGLADESH' AND C='Varner-Gruppen' AND H CONTAINS "Gazipur"

try a contains

That looks a little more promising although it does suggest we may need to do a bit of tidying on the dataset, which is what a tool such as OpenRefine is ideal for… But that would be the subject of another post…

What you might also realise from running these queries is how the way you model your data in a database or a spreadsheet – for example, what columns you decide to use and what values you put into those columns – may directly influence the sorts of questions you can ask of it.

Recap

In this post, we have seen how data stored in a Google Spreadsheet can be queried as if it were stored in a database. Queries can be used to generate views that represent a subset of all the data in a particular spreadsheet sheet (sic). As well as interactive tables and even chart views over the data that these queries return, we can create HTML table views or even CSV file representations of the data, each with their own URL.

As well as selecting individual columns and rows from the dataset, we can also use queries to generate simple reports over the data, such as splitting it into groups and counting the number of results in each group.

Although it represents a cut down version of the SQL query language, the Google Query Language is still very powerful. To see the full extent of what it can do, check out the Google Query Language documentation.

If you come up with any of your own queries over the garment factory database that are particularly interesting, why not share them here using the comments below?:-)

Flattr this!