Asking Questions of Data – Garment Factories Data Expedition
As preparation for the upcoming data expedition on Mapping the garment factories this weekend, several intrepid explorers have been collating data from brand supplier lists that identify the location of over 3,000 factories to date.
The data is being published via a Google Spreadsheet, which means we can also treat it as a database, asking database like queries either within the spreadsheet itself, or via a webservice.
The School of Data blogpost Asking Questions of Data – Some Simple One-Liners introduced the idea of using SQL – the Structured Query Language – to ask questions of a dataset contained in a small database populated with data that had been “liberated” using Scraperwiki. The query language that Google Spreadsheets supports is rather like a cut down version of SQL, so it can be a good place to start learning how to write such queries.
The query language allows us to select just those databasespreadsheet rows where a particular column contains a particular value, such as rows relating to factories located in a particular country or supplying a particular brand. We can also create more complex queries, for example identifying factories located in a particular country that supply a particular brand. We can also generate summary reports, such as listing all the brands identified, or counting all the factories within each city in a particular country.
I’ve posted an informal, minimal interface to the query API here: Google Spreadsheet Query Interface (feel free to clone the view and improve on it!)
Paste in the spreadsheet key value, which for the garment factory spreadsheet is 0AvdkMlz2NopEdEdIZ3d4VlFJQ0NkazhrWGFQdXZQMkE, along with the sheet’s “gid” value – 0 for the sheet we want. If you click on the Preview button, we can see the column headings:
We can now start to ask questions of the data, building up a query around the different spreadsheet columns. For convenience (?!), we can use the letters that identify each column in the spreadsheet to help build up out query.
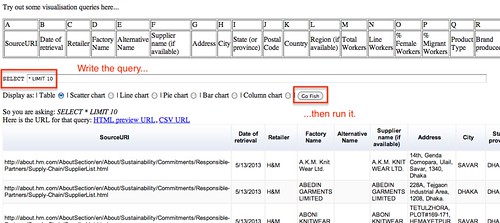
Let’s start with a simple query that shows all the columns (*) for the first 10 rows (LIMIT 10)
We would write the query out in full as:
SELECT * LIMIT 10
but the form handles the initial SELECT statement for us, so all we need to write is:
* LIMIT 10
Run the query by clicking ion the “Go Fish” button, and the results should appear in a table.
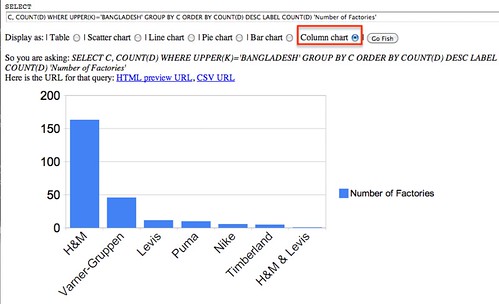
Note that you can sort the rows in the table by clicking on the appropriate column header. The query form also allows you to preview queries using a variety of charts, although for these to work you will need to make sure you select appropriate columns as we’ll see later.
As well as generating a tabular (or chart based) view of the results, the running the query also generates couple of links, one to an HTML table view of the results, one to a CSV formatted version of the data.
If you look at the web addresses/URLs that are generated for these links, you may notice they are “hackable” (Hunting for Data – Learning How to Read and Write Web Addresses, aka URLs ).
Knowing that the spreadsheet provides us with database functionality allows us to do two different things. Firstly, we can run queries on the data to generate subsets of it, for example as CSV files, that we can load into other tools for analysis purposes. Secondly, we can generate reports on the data that may themselves be informative. Let’s look at each in turn.
Generating subsets of data
In the simplest case, there are two main ways we can generate subsets of data. If you look at the column headings, you will notice that we have separate columns for different aspects of the dataset, such as the factory name, the company it supplies, the country or city it is based in, and so on. Not all the separate factory results (that is, the separate rows of data) have data in each column, which is something we may need to be aware of!)
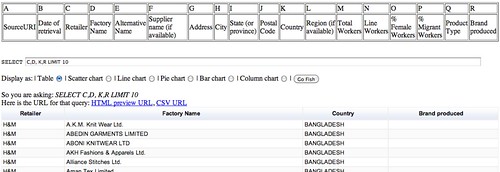
In some reports, we may not want to see all the columns, so instead we can select just those columns we want:
SELECT C, D, K,R LIMIT 10
To see all the results, remove the LIMIT 10 part of the query.
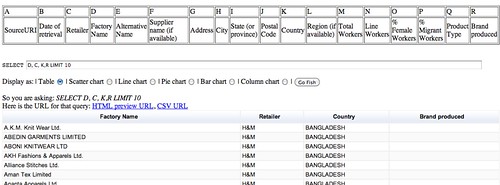
We can also rearrange the order of columns by changing the order in which they appear in the query:
SELECT D, C, K, R LIMIT 10
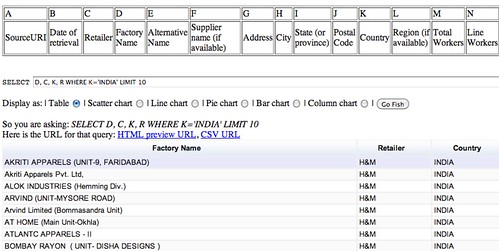
The second form of subsetting we can do is to limit the rows that are displayed dependent on whether they contain a particular value, or more specifically, when the value of a cell from that row contains a particular value in a particular column.
So for example, here’s a glimpse of some of the factories that are located in India:
SELECT D, C, K, R WHERE K='INDIA' LIMIT 10
To see all the countries that are referenced, some query languages allow us to use a DISTINCT search limit. The Google Query Language does not support the DISTINCT operator, but we can find another way of getting all the unique values contained within a column using the GROUP BY operator. GROUP BY says “find all the elements in a column that have the same value, and for each of these groups, do something with it”. The something-we-can do might simply be to count the number of the rows in the group, we which can do as follows (COUNTing on any column other than the GROUP BY column(s) will do).
SELECT K, COUNT(A) GROUP BY K LIMIT 10
See if you can work out how to find the different Retailers represented in the dataset. Can you also see how to find the different retailers represented in a particular country?
One of the things you may notice from the above result is that “ARGENTINA” and “Argentina” are not the same, and neither are ‘BANGLADESH’ and ‘Bangladesh’…
If we wanted to search for all the suppliers listed in that country, we could do a couple of things:
- SELECT C, K WHERE K='BANGLADESH' OR K='Bangladesh' – in this case, we accepts results where the Country column value for a given row is either “BANGLADESH” or it is “Bangladesh”.
-
SELECT C, K WHERE UPPER(K)='BANGLADESH' – in this case, we set the cell value to its uppercase equivalent, and then test to see if it matches ‘BANGLADESH’
In a certain sense, the latter query style is applying an element of data cleansing to the data as it runs the query.
Creating Simple Reports
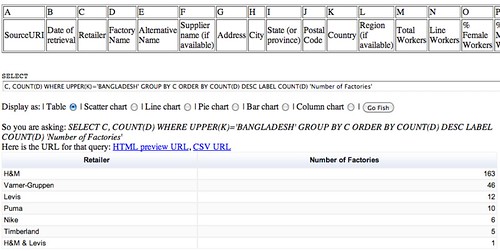
Sticking with Bangladesh for a while, let’s see how many different factories each of the different retailers appears to have in that country.
SELECT C, COUNT(D) WHERE UPPER(K)='BANGLADESH' GROUP BY C
That works okay-ish, but we could tidy the results up little. We could sort the results by clicking on the count column header in the table, but we could also the the ORDER BY query limit to order the results (ASC for ascending order, DESC for descending). We can also change the LABEL that appears in the calculated column heading.
SELECT C, COUNT(D) WHERE UPPER(K)='BANGLADESH' GROUP BY C ORDER BY COUNT(D) DESC LABEL COUNT(D) 'Number of Factories'
As well as viewing the results of the query as a table, if the data is in the right form, we may be able to get a chart view of it.
Remember, running the query also generates links to HTML table or CSV versions of the resulting data set.
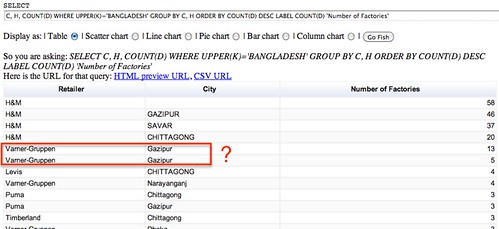
As you get more confident writing queries, you might find they increase in complexity. For example, in Bangladesh, how many factories are on the supplier list of each manufacturer in each City?
SELECT C, H, COUNT(D) WHERE UPPER(K)='BANGLADESH' GROUP BY C, H ORDER BY COUNT(D) DESC LABEL COUNT(D) 'Number of Factories'
Note that as we ask these more complicated queries – as in this case, where we are grouping by two elements (the supplier and the city) – we start stressing the data more; and as we stress the data more, we may start to find more areas where we may have data quality issues, or where further cleaning of the data is required.
In the above case, we might want to probe why there are two sets of results for Varner-Gruppen in Gazipur?
SELECT C, H, D WHERE UPPER(K)='BANGLADESH' AND C='Varner-Gruppen' AND H = "Gazipur"
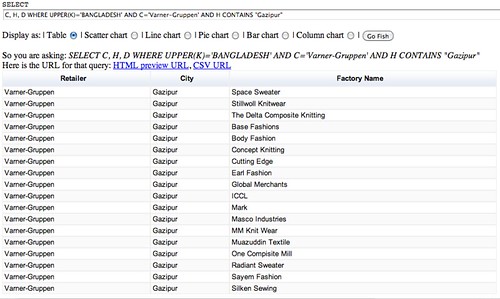
Hmm… only five results? maybe some of the cells actually contain white space as well as the city name? We can get around this by looking not for an exact string match on the city name, but instead looking to see if the cell value in the spreadsheet CONTAINS the search string we are looking for:
SELECT C, H, D WHERE UPPER(K)='BANGLADESH' AND C='Varner-Gruppen' AND H CONTAINS "Gazipur"
That looks a little more promising although it does suggest we may need to do a bit of tidying on the dataset, which is what a tool such as OpenRefine is ideal for… But that would be the subject of another post…
What you might also realise from running these queries is how the way you model your data in a database or a spreadsheet – for example, what columns you decide to use and what values you put into those columns – may directly influence the sorts of questions you can ask of it.
Recap
In this post, we have seen how data stored in a Google Spreadsheet can be queried as if it were stored in a database. Queries can be used to generate views that represent a subset of all the data in a particular spreadsheet sheet (sic). As well as interactive tables and even chart views over the data that these queries return, we can create HTML table views or even CSV file representations of the data, each with their own URL.
As well as selecting individual columns and rows from the dataset, we can also use queries to generate simple reports over the data, such as splitting it into groups and counting the number of results in each group.
Although it represents a cut down version of the SQL query language, the Google Query Language is still very powerful. To see the full extent of what it can do, check out the Google Query Language documentation.
If you come up with any of your own queries over the garment factory database that are particularly interesting, why not share them here using the comments below?:-)







Leave a Reply