You are browsing the archive for Data Journalism.

The Data Journalism Bootcamp at AUB Lebanon

- January 29, 2015 in Data Journalism, Events, Fellowship, Блог, Интернационален

Data love is spreading like never before. Unlike previous workshops we did in the MENA region, on the 18th of January 2015, we gave an intensive data journalism workshop at the American University of Beirut for four consecutive days in collaboration with Dr. Jad Melki, Director of media studiesilovedata program at AUB. The Data team at Data Aurora were really happy sharing this experience with students from different academic backgrounds, including media studies, engineering or business.

The workshop was mainly led by Ali Rebaie, a Senior School of Data fellow, and Bahia Halawi, a data scientist at Data Aurora, along with the data community team assistants; Zayna Ayyad, Noor Latif and Hsein Kassab. The aim of the workshop was to give the students an introduction to the world of open data and data journalism, in particular, through tutorials on open source tools and methods used in this field. Moreover, we wanted to put students on track regarding the use of data.AUBworkshop

On the first day, the students were introduced to data journalism, from a theoretical approach, in particular, the data pipeline which outlined the different phases in any data visualization project: find, get, verify, clean, analyze and present. After that, students were being technically involved in scraping and cleaning data using tools such as open refine and Tabula.

Day two was all about mapping, from mapping best practices to mapping formats and shapes. Students were first exposed to different types of maps and design styles that served the purpose of each map. Moreover, best mappings techniques and visualizations were emphasized to explain their relative serving purpose. Eventually, participants became able to differentiate between the dot maps and the choropleth maps as well as many others. Then they used twitter data that contained geolocations to contrast varying tweeting zones by placing these tweets at their origins on cartodb. Similarly, they created other maps using QGIS and Tilemill. The mapping exercises were really fun and students were very happy to create their own maps without a single line of code.

On the third day, Bahia gave a lecture on network analysis, some important mathematical notions needed for working with graphs as well as possible uses and case studies related to this field. Meanwhile, Ali was unveiling different open data portals to provide the students with more resources and data sets. After these topics were emphasized, a technical demonstration on the use of network analysis tool to analyze two topics wasworkshopaub performed. Students were analyzing climate change and later, the AUB media group on Facebook was also analyzed and we had its graph drawn. It was very cool to find out that one of the top influencers in that network was among the students taking the training. Students were also taught to do the same analysis for their own friends’ lists. Facebook data was being collected and the visualizations were being drawn in a network visualization tool.

After completing the interactive types of visualizations, the fourth day was about static ones, mainly, infographics. Each student had the chance to extract the information needed for an interesting topic to transform it into a visual piece.  Bahia was working around with students, teaching them how to refine the data so that it becomes simple and short, thus usable for building the infographic design. Later, Yousif, a senior creative designer at Data Aurora, trained the students on the use of Photoshop and illustrator, two of the tools commonly used by infographic designers. At the end of the session, each student submitted a well done infographic of which some are posted below.

After the workshop Zayna had small talks with the students to get their feedback and here she quoted some of their opinions:

“It should be a full course, the performance and content was good but at some point, some data journalism tools need to be more mature andStatic Infographics developed by the students at the workshop. user-friendly to reduce the time needed to create a story,” said Jad Melki, Director of media studies program at AUB, “it was great overall.”

“It’s really good but the technical parts need a lot of time. We learned about new apps. Mapping, definitely I will try to learn more about it,” said Carla Sertin, a media student.

“It was great we got introduced to new stuff. Mapping, I loved it and found it very useful for me,” said Ellen Francis, civil engineering student. “The workshop was a motivation for me to work more on this,” she added, “it would work as a one semester long course.”

Azza El Masri, a media student, is interested in doing MA in data journalism. “I like it I expected it to be a bit harder, I would prefer more advanced stuff in scraping,” she added.


Flattr this!

Global Witness and Open Knowledge – Working together to investigate and campaign against corruption related to the extractives industries

- November 17, 2014 in Data Journalism

Sam Leon, one of Open Knowledge’s data experts, talks about his experiences working as an School of Data Embedded Fellow at Global Witness.

Global Witness are a Nobel Peace Prize nominated not-for-profit organisation devoted to investigating and campaigning against corruption related to the extractives industries. Earlier this year they received the TED Prize and were awarded $1 million to help fight corporate secrecy and on the back of which they launched their End Anonymous Companies campaign.


In February 2014 I began a six month ‘Embedded Fellowship’ at Global Witness, one of the world’s leading anti-corruption NGOs. Global Witness are no strangers to data. They’re been publishing pioneering investigative research for over two decades now, piecing together the complex webs of financial transactions, shell companies and middlemen that so often lie at the heart of corruption in the extractives industries.

Like many campaigning organisations, Global Witness are seeking new and compelling ways to visualise their research, as well as use more effectively the large amounts of public data that have become available in the last few years.

“Sam Leon has unleashed a wave of innovation at Global Witness”

-Gavin Hayman, Executive Director of Global Witness

As part of my work, I’ve delivered data trainings at all levels of the organisation – from senior management to the front line staff. I’ve also been working with a variety of staff to use data collected by Global Witness to create compelling infographics. It’s amazing how powerful these can be to draw attention to stories and thus support Global Witness’s advocacy work.

The first interactive we published on the sharp rise of deaths of environmental defenders demonstrated this. The way we were able to pack some of the core insights of a much more detailed report into a series of images that people could dig into proved a hit on social media and let the story travel further.

GW Info

See here for the full infographic on Global Witness’s website.

But powerful visualisation isn’t just about shareability. It’s also about making a point that would otherwise be hard to grasp without visual aids. Global Witness regularly publish mind-boggling statistics on the scale of corruption in the oil and gas sector.

“The interactive infographics we worked on with Open Knowledge made a big difference to the report’s online impact. The product allowed us to bring out the key themes of the report in a simple, compelling way. This allowed more people to absorb and share the key messages without having to read the full report, but also drew more people into reading it.”
-Oliver Courtney, Senior Campaigner at Global Witness

Take for instance, the $1.1 billion that the Nigerian people were deprived of due to the corruption around the sale of Africa’s largest oil block, OPL 245.

$1.1 billion doesn’t mean much to me, it’s too big of a number. What we sought to do visually was represent the loss to Nigerian citizens in terms of things we could understand like basic health care provision and education.

See here for the full infographic on Shell, ENI and Nigeria’s Missing Millions.

In October 2014, to accompany Global Witness’s campaign against anonymous company ownership, we worked with developers from data journalism startup J++ on The Great Rip Off map.

The aim was to bring together and visualise the vast number of corruption case studies involving shell companies that Global Witness and its partners have unearthed in recent years.

The Great Rip Off!

It was a challenging project that required input from designers, campaigners, developers, journalists and researchers, but we’re proud of what we produced.

Open data principles were followed throughout as Global Witness were committed to creating a resource that its partners could draw on in their advocacy efforts. The underlying data was made available in bulk under a Creative Commons Attribution Sharealike license and open source libraries like Leaflet.js were used. There was also an invite for other parties to submit case studies into the database.

“It’s transformed the way we work, it’s made us think differently how we communicate information: how we make it more accessible, visual and exciting. It’s really changed the way we do things.”
-Brendan O’Donnell, Campaign Leader at Global Witness

For more information on the School of Data Embedded Fellowship Scheme, and to see further details on the work we produced with Global Witness, including interactive infographics, please see the full report here.

Flattr this!

Data for Social Change in South Africa

- September 29, 2014 in Community, Data Blog, Data Expeditions, Data for CSOs, Data Journalism, School_Of_Data


We recently kicked off our first local Code for South Africa School of Data workshops in Johannesburg and Cape Town for journalists and civil society respectively.

I arrived in the vibrant Maboneng district in central Johannesburg excited (and a little nervous) about helping my fellow school of Data Fellow Siyabonga facilitate our first local workshop with media organisations The Con and Media Monitoring Africa. Although I’ve attended a data workshop this was my first experience of being on the other end and it was an incredible learning experience. Siya did a fantastic job of leading the organisations in defining and conceptualising their data projects that they’ll be working on over the course of the rest of the year and I certainly borrowed and learned a lot from his workshop format.

It was great to watch more experienced facilitators, Jason from Code for South Africa and Michael from The School of Data, work their magic and share their expert knowledge on more advanced tools and techniques for working with and presenting data and see the attendees eyes light up at the possibilities and potential applications of their data.

Johannesburg sunset

Johannesburg sunset at the workshop venue

A few days later we found ourselves back in the thick of things giving the second workshop in Cape Town for civil society organisations Black Sash and Ndifuna Ukwazi. I adapted Siyabonga’s workshop format slightly, shifting the emphasis from journalism to advocacy and effecting social change for our civil society attendees.

We started off examining the broader goals of the organisation and worked backwards to identify where and how data can help them achieve their goals, as data for data’s sake in isolation is meaningless and our aim is to help them produce meaningful data projects that make a tangible contribution to their goals.

The team from Ndifuna Ukwazi at work

The team from Ndifuna Ukwazi at work

We then covered some general data principles and skills like the data pipeline and working with spreadsheets and easy-to-use tools like Datawrapper and Infogr.am, as well as some more advanced (and much needed) data cleaning using Open Refine as well as scraping data using Tabula which the teams found extremely useful, having been manually typing out information from pdfs up until this point.

Both organisations arrived with the data they wanted to work with at hand and it immediately became apparent that it needed a lot of cleaning. The understanding the organisations gained around working with data allowed them to reexamine the way they collect and source data, particularly for Black Sash who realised they need to redesign their surveys they use. This will be an interesting challenge over the next few months as the survey re-design will still need to remain compatible with the old survey formats to be useful for comparison and analysis and I hope to be able to draw on the experience and expertise of the School of Data network to come up with a viable solution.

BlackSash_at_work

Siya working his magic with the Black Sash team

By the end of the workshop both organisations had produced some visualisations using their data and had a clear project plan of how they want to move forward, which I think is a great achievement! I was blown away by the enthusiasm and work ethic of the attendees and I’m looking forward to working with them over the next few months and helping them produce effective data projects that will contribute to more inclusive, equitable local governance.


Flattr this!

Dispatch from India: Intro to Data Journalism Workshop in Bangalore

- September 12, 2014 in Data Journalism, School_Of_Data, Uncategorized

This post is crossposted from DataMeet.org, an organization that promotes open data in India.

Sunday, August 31st, DataMeet worked with an Economic Times Journalist Jayadevan PK with support from School of Data, to design an intro to data journalism workshop. For a while now there has been quite a bit of interest and discussion of data journalism in India. Currently there are a few courses and events around promoting data journalism, we thought there was definitely room to start to build a few modules on working with data for storytelling. Given that we have not done too many of these we decided to do an introduction and leave it limited to a few people.

Datameet1

You can see the agenda with notes here and the resources we shared on the data journalism resource wiki page, as well as refer to the data catalog that DataMeet has been putting together.

Thanks to Knolby Media for hosting us and for School of Data for the support. Thank you to Vikras Mishra for volunteering and taking notes, pictures, and video.

We had four story tellers with us, from various backgrounds. We spent the morning doing introduction and what was their experience with data, what their definition of data journalism is and why they wanted to take this workshop. Then we had them put up some expectations so we can gauge what the afternoon should focus on.

20140831_155101

We then had Jaya go through the context of data journalism in terms of the world scale and the new digital journalism era.

Then we spent some time going over examples of good data journalism and bad.

After we went through resources people can use to get data. We touched upon the legal issues around using data and copyright issues. Then we discussed accuracy and how to properly attribute sources.

Then we demonstrated a few tools

Datameet 5

Tableau
CartoDB
Scraping tools
– Scraper wiki
– IMACROS
MapBox
QGIS

Visualization Roadmap
The participants thought understanding how to visualize would be helpful.  So we went through a sort of visualization roadmap.  Then went through stories they were working on to see how we would create a visualization and also how to examine the data and come up with a data strategy for each story.

Datameet 6 20140831_155126

Then showed some more tools to address the suggestions from the exercise.
– BHUVAN
– Timelines
– Odyssey
– Fusion Tables
– BUMP

Feedback session

Datameet2

People wanted another day to let the lessons be absorbed and some more time to actually have hands on time with the tools.  Also even at the intro level it is important to make people come prepared with stories, so they have something to apply the ideas to.

To say we learned a lot is an understatement. We will definitely be planning more intro workshops and hopefully more advanced workshops in the future, we hope to continue to learn what people think is important and will keep track and see what kinds of stories come out of these learning session.


Flattr this!

Using Data Journalism to probe economics in the West Bank

- August 27, 2014 in Data Expeditions, Data Journalism

Ramallah Cityscape

Weeks before the current conflict erupted between Israel and Hamas, twenty Palestinian journalists came together in Ramallah for three days to use data to untangle the economic reality for Palestinians.

The fourth in a series of workshops aimed at establishing economic beat reporting in the West Bank, the Data Journalism for Economic Reporting workshop immersed journalists in the raw economic data that could provide objective, analytical content on a highly politicized local and global topic and explore viable solutions.

Watch a video from one of the workshops:

For the first time, journalists took a deeper look at the data behind buzzwords such as “economic peace” and “economic packages” that form part of the negotiation process between Israel, the Palestinians and donors. Almost immediately journalists identified cases in which a better understanding of data would have served the needs of their audience.

When the World Bank issued the report Area C and the Future of the Palestinian Economy, most journalists just reported on it using a version of the official press release Palestinians Access to Area C Key to Economic Recovery and Sustainable Growth. None requested the raw data to determine what areas of the economy have the most growth potential, what policy changes would be key in negotiating for market growth and what vocational and other educational programs could be put into place to prepare the workforce for a lifting of current restrictions.

“The language of statistics and figures are stronger and more credible,” explained Abubaker Qaret from PADECO Co, an investment firm.

Participants planned to both request the data from the World Bank study and investigate audit data from the donors who keep the Palestinian Authority afloat.

Over the course of three days, journalists practiced the skills to produce the first data-driven economic reporting in the West Bank. Trainees learned to scrape data (extract data from human-readable output) using scraper extensions, identify story angles in monthly economic data releases, answer basic questions about economic growth and government spending using Excel and visualize their findings using Google Charts.

Akram Natcha, a journalist from Al-Quds TV has a financial background but had not thought to apply some of the technical skills to his journalistic work. “This is the first time I used Excel data analysis with the aim of publishing.”

During a Google Charts visualization exercise, trainees used data scraped from PDFs downloaded from the Palestinian Ministry of Finance website to calculate and visualize which sectors of the economy experienced the largest growth during 2013.

Abubaker Qurt visualized his findings:

Trainees also compared unemployment rates and demographics to other countries in the region, calculated growth and absorption rates of the Palestinian Territories’ current workforce and calculated the per capita international aid received compared with its neighbors. They then practiced translating this information into narrative storytelling that would put a human face on pressing economic issues.

The Data Expedition that concluded the workshop focused on evaluating the Palestinian Authority’s fiscal management by examining the last three years of government expenditure data. In groups, trainees proposed and honed in on three specific questions:

  • Which government departments spend the largest portion of their budget on wages and least on implementing projects and which department is responsible for spending the most overall on staff costs?
  • How did spending on neglected areas such as cultural heritage and scientific research compare to how much was allocated by regional neighbors for those activities?
  • How do trends in investment in education correlate to results on standardized tests and growth in related economic areas?

Following the workshop, several participants pursued and published investigations into the economic impact of the heightened presence of the Israeli army in the West Bank.

“I benefited from the workshop to identify story angles through the tables,” said Rabee Dweikat a press officer at the Bank of Palestine. “I discovered new information from the data.”

The training series is funded by the US Consulate in Jerusalem.

This post is cross posted from the Internews Blog

Flattr this!

Seven Ways to Create a Storymap

- August 25, 2014 in Data Journalism, Data Stories, HowTo, Storytelling

If you have a story that unfolds across several places over a period of time, storymaps can provide an engaging interactive medium with which to tell the story. This post reviews some examples of how interactive map legends can be used to annotate a story, and then rounds up seven tools that provide a great way to get started creating your own storymaps.

Interactive Map Legends

The New York Times interactives team regularly come up with beautiful ways to support digital storytelling. The following three examples all mahe use of floating interactive map legends to show you the current location a story relates to as they relate a journey based story.

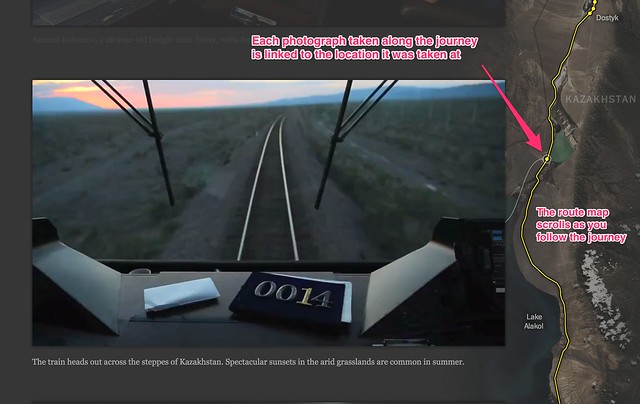
Riding the Silk Road, from July 2013, is a pictorial review featuring photographs captured from a railway journey that follows the route of the Silk Road. The route is traced out in the map on the left hand side as you scroll down through the photos. Each image is linked to a placemark on the route to show where it was taken.
Riding_the_New_Silk_Road_-_Interactive_Feature_-_NYTimes_com

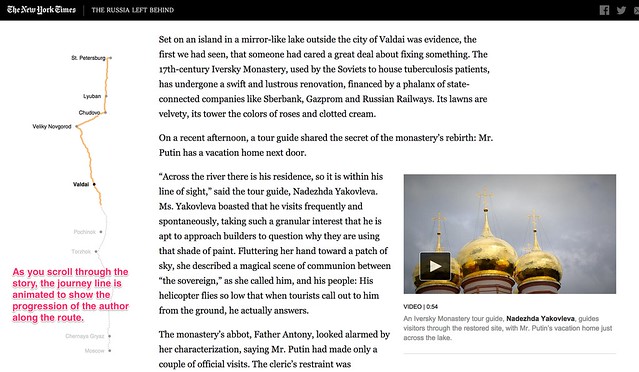
The Russia Left Behind tells the story of a 12 hour drive from St. Petersburg to Moscow. Primarily a textual narrative, with rich photography and video clips to illustrate the story, an animated map legend traces out the route as you read through the story of the journey. Once again, the animated journey line gives you a sense of moving through the landscape as you scroll through the story.
The_Russia_Left_Behind

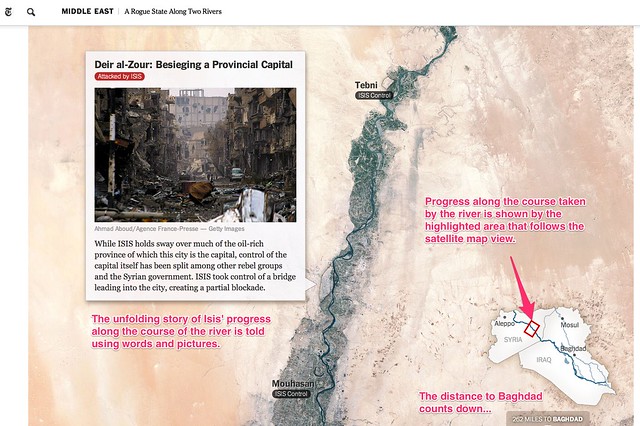
A Rogue State Along Two Rivers, from July 2014, describes the progress made by Isis forces along the Tigris and Euphrates Rivers is shown using two maps. Each plots the course of one of the rivers and uses place linked words and photos to tell the story of the Isis manoeuvres along each of the river ways. An interactive map legend shows where exactly along the river the current map view relates to, providing a wider geographical context to the local view shown by the more detailed map.
A_Rogue_State_Along_Two_Rivers_-_NYTimes_com

All three of these approaches help give the reader a sense of motion though the journey traversed that leads the narrator being in the places described at different geographical storypoints described or alluded to in the written text. The unfolding of the map helps give the reader the sense that a journey must be taken to get from one location to another and the map view – and the map scale – help the reader get a sense of this journey both in terms of the physical, geographical distance it relates to and also, by implication, the time that must have been expended on making the journey.

A Cartographic Narrative

Slave Revolt in Jamaica, 1760-1761, a cartographic narrative, a collaboration between Axis Maps and Harvard University’s Vincent Brown, describes itself as an animated thematic map that narrates the spatial history of the greatest slave insurrection in the eighteenth century British Empire. When played automatically, a sequence of timeline associated maps are played through, each one separately animated to illustrate the supporting text for that particular map view. The source code is available here.
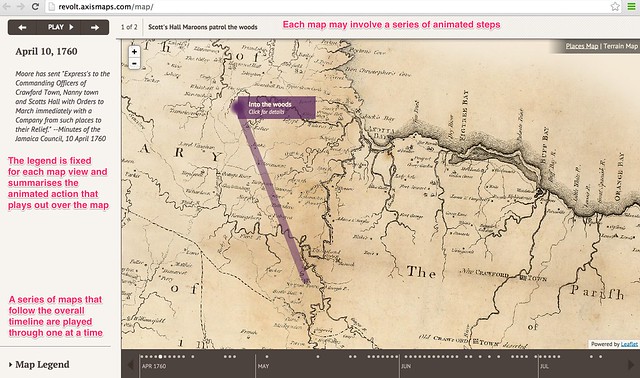
Jamaican_Slave_Revolt

This form of narrative is in many ways akin to a free running, or user-stepped, animated presentation. As a visual form, it also resembles the pre-produced linear cut scenes that are used to set the scene or drive the narrative in an interactive computer game.

Creating you own storymaps

The New York Times storymaps use animated map legends to give the reader the sense of going on a journey by tracing out the route being taken as the story unfolds. The third example, A Rogue State Along Two Rivers also makes use of a satellite map as the background to the story, which at it’s heart is nothing more than a set of image markers placed on to an an interactive map that has been oriented and constrained so that you can only scroll down. Even though the maps scrolls down the page, the inset legend shows the route being taken may not be a North-South one at all.

The linear, downward scroll mechanic helps the reader feel as if they are reading down through a story – control is very definitely in the hands of the author. This is perhaps one of the defining features of the story map idea – the author is in control of unraveling the story in a linear way, although the location of the story may change. The use of the map helps orientate the reader as to where the scenes being described in the current part of the story relate to, particularly any imagery.

Recently, several tools and Javascript code libraries have been made available from a variety of sources that make it easy to create your own story maps within which you can tell a geographically evolving story using linked images, or text, or both.

Knight Lab StoryMap JS

The Knight Lab StoryMap JS tool provides a simple editor synched to a Google Drive editor that allows you to create a storymap as a sequence of presentation slides that each describe a map location, some header text, some explanatory text and an optional media asset such as an image or embedded video. Clicking between slides animates the map from one location to the next, showing a line between consecutive points to make explicit the linkstep between them. The story is described using a custom JSON data format saved to the linked Google Drive account.
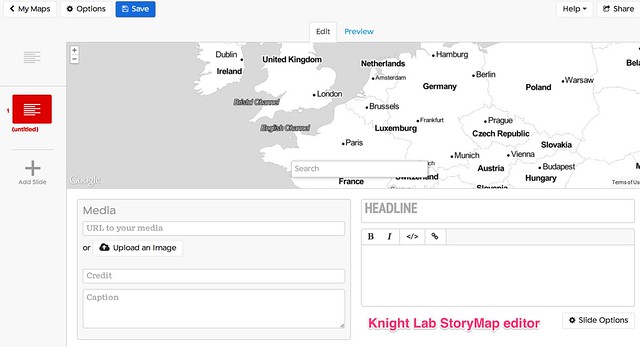
knightStoryMap_editor

[StoryMapJS code on Github]

CartoDB Odyssey.js

Odyssey.js provides a templated editing environment that supports the creation of three types of storymap: a slide based view, where each slide displays a location, explanatory text (written using markdown) and optional media assets; a scroll based view, where the user scrolls down through a stroy and different sections of the story trigger the display of a particular location in a map view fixed at the top of the screen; and a torque view which supports the display and playback of animated data views over a fixed map view.
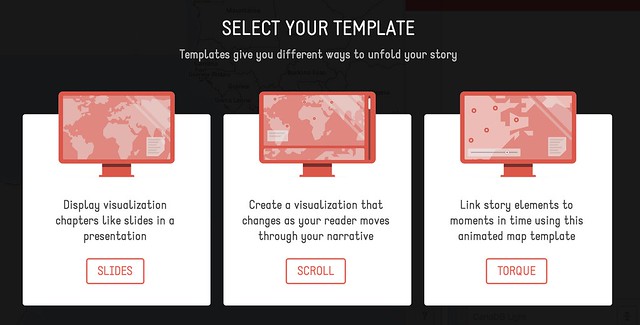
Odyssey_js_Sandbox

A simple editor – the Odyssey sandbox – allows you to script the storymap using a combination of markdown and map commands. Storymaps can be published by saving them to a central githib repository, or downloaded as an HTML file that defines the storymap, bundled within a zip file that contains any other necessary CSS and Javascript files.

[Odyssey.js code on Github]

Open Knowledge TimeMapper

TimeMapper is an Open Knowledge Labs project that allows you to describe location points, dates, and descriptive text in a Google spreadsheet and then render the data using linked map and timeline widgets.
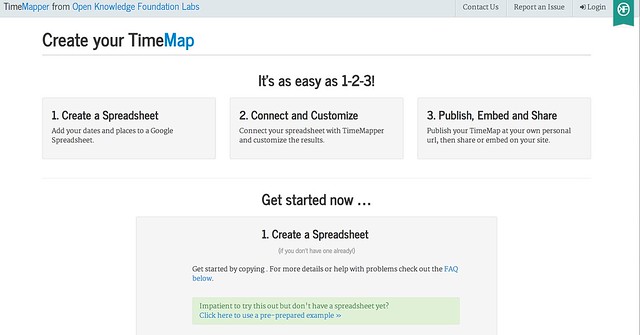
Create_-_TimeMapper_-_Make_Timelines_and_TimeMaps_fast__-_from_the_Open_Knowledge_Foundation_Labs

[Timemapper code on Github]

JourneyMap (featuring waypoints.js

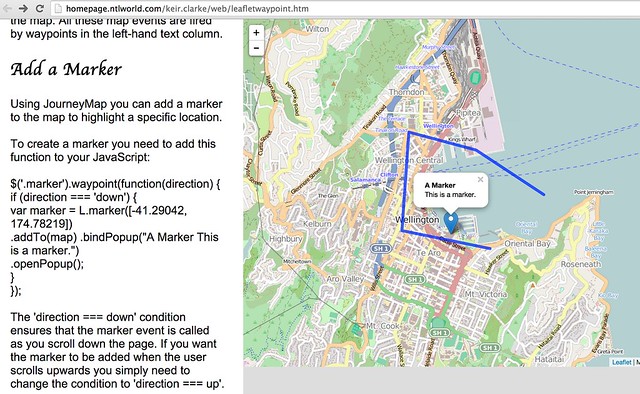
JourneyMap is a simple demonstration by Keir Clarke that shows how to use the waypoints.js Javascript library to produce a simple web page containing a scrollable text area that can be used to trigger the display of markers (that is, waypoints) on a map.
Journey_Map

[waypoints.js on Githhub; JourneyMap src]

Google Earth TourBuilder

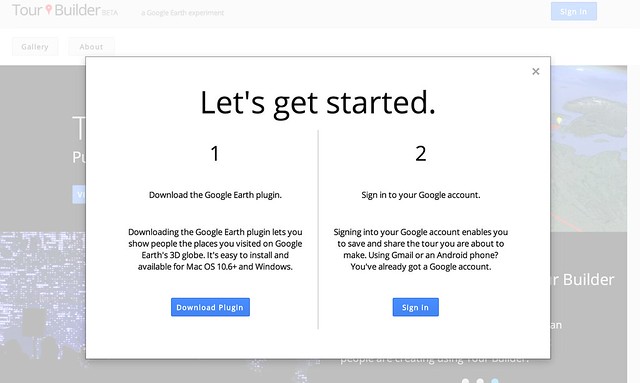
Google Earth TourBuilder is a tool for building interactive 3D Google Earth Tours using a Google Earth browser plugin. Tours are saved (as KML files?) to a Google Drive account.
Tour_Builder

[Note: Google Earth browser plugin required.]

ESRI/ArcGIS Story Maps

ESRI/ArcGIS Story Maps are created using an online ArcGIS account and come in three type with a range of flavours for each type: “sequential, place-based narratives” (map tours), that provide either an image carousel (map tour) that allows you to step through a sequence of images that are displayed separately alongside a map showing a corresponding location or a scrollable text (map journal) with linked location markers (the display of half page images rather than maps can also be triggered from the text); curated points-of-interest lists that provide a palette of images, each member of which can be associated with a map marker and detailed information viewed via a pop-up (shortlist), a numerically sequence list that displays map location and large associated images (countdown list), and a playlist that lets you select items from a list and display pop up infoboxes associated with map markers; or map comparisons provided either as simple tabbed views that allow you to describe separate maps, each with its own sidebar description, across a series of tabs, with separate map views and descriptions contained within an accordion view, and swipe maps that allow you to put one map on top of another and then move a sliding window bar across them to show either the top layer or the lower layer. A variant of the swipe map – the spyglass view alternatively displays one layer but lets you use a movable “spyglass” to look at corresponding areas of the other layer.

App_List___Story_Maps

[Code on github: map-tour (carousel) and map journal; shortlist (image palette), countdown (numbered list), playlist; tabbed views, accordion map and swipe maps]

Leaflet.js Playback

Leaflet.js Playback is a leaflet.js plugin that allows you to play back a time stamped geojson file, such as a GPS log file.

LeafletPlayback

[Code on Github]

Summary

The above examples describe a wide range of geographical and geotemporal storytelling models, often based around quite simple data files containing information about individual events. Many of the tools make a strong use of image files as pat of the display.

it may be interesting to complete a more detailed review that describes the exact data models used by each of the techniques, with a view to identifying a generic data model that could be used by each of the different models, or transformed into the distinct data representations supported by each of the separate tools.

UPDATE 29/8/14: via the Google Maps Mania blog some examples of storymaps made with MapboxGL, embedded within longer form texts: detailed Satellite views, and from the Guardian: The impact of migrants on Falfurrias [scroll down]. Keir Clarke also put together this demo: London Olympic Park.

UPDATE 31/8/14: via @ThomasG77, Open Streetmap’s uMap tool (about uMap) for creating map layers, which includes a slideshow mode that can be used to create simple storymaps. uMap also provides a way of adding a layer to map from a KML or geojson file hosted elsewhere on the web (example).

Flattr this!

Data Journalism in Developing Countries: Getting Beyond the Hype

- August 15, 2014 in Data Journalism

One groups visualizes when it is best to use radio to explain data instead of charts

One group visualizes when it is best to convey data findings over radio instead of charts depending on the audience’s data literacy and reliance on traditional media for information.


Data journalism has tremendous potential to drive transparency and reveal corruption in developing countries and many donors are funding data journalism as a means to good governance and transparency. The Defining and Designing Successful Data Journalism Initiatives in Developing Countries session at the 2014 Open Knowledge Festival focused on what it takes to grow a sustainable data community. In groups composed of journalists, developers, CSO representatives and other open advocates, we evaluate the most common strategies such as conferences, boot camps, fellowships, hackathons and reporting grants and discussed openly whether they had produced concrete data journalism that has had a social and policy impact.

To kick things off, I shared my own perspective on successes and failures by the media development community. The fastest and cheapest way to try to introduce data journalism is through Data Journalism Boot Camps. The model is based on the belief that a week-long (or sometimes three-day) training in the fundamentals of data journalism would give journalists just the push they needed to start fighting corruption through awesome visuals and news apps. But, just as a one-week conventional boot camp can hardly be expected to produce a special ops unit, the workshops do not produce a cadre of global journo-coders and what’s worse, they often gloss over topics like privacy, statistical errors and ethical reporting. In fact, many boot camps never result in a single data-driven story, despite a flurry of Twitter traffic that suggested that places like Nigeria, Nepal, and Bolivia are the next rising stars in data journalism.

My contrasting success story explored the four-month fellowship model where a group of talented media professionals (journalists, a graphic designer and developer) in Kenya dedicated themselves to learning new skills and producing experimental content and storytelling for their home media outlets but working from the Internews in Kenya data desk. For us, the fellowship served several purposes. It immersed the fellows in months of intensive training as each module built up their cumulative skills; it introduced them to data sources, including think tanks and government, that the journalists could use for stories when they returned to their media outlets; and it encouraged them to work as a team to complete two major investigations each, which they published before the end of the fellowship and earned them a reputation as data journalists.

Next, the 50+ participants worked in groups to identify their most illustrative examples of success and failures to help others design smarter activities. Examples included great budget visualizations that engaged the public through the media, but only one person on the team actually knew how to use the software to produce the visualization. On the flip side, another group had created a website to visualize aid data but nobody ever accessed the site and those who did found it confusing. Both of these experiences illustrated the need to establish who needs to be trained to ensure a viable product that can be maintained after the initial launch and how the target audience consumes news, which, in the case of many of our participants, is offline.

A common theme addressed difficulties in bringing together developers and journalists on projects. One group sited a successful example of a mapping platform in Latin America that superimposes environmental journalism stories on maps of environmental data such as protected zones and mining areas. This way, both data and traditional storytelling are present on the same platform. Another group paired an NGO that designed and implemented a public opinion poll with journalists who published the results. In both cases, the developers and statisticians generating data stuck with the skills they were good at while the journalists became more data literate but were not expected to become journo-coders in order to report on data.

Another participant from South Africa highlighted the challenges of embedding coders in newsrooms, who generally end up either isolated or overwhelmed by newsrooms either indifferent to data or too demanding for digital products. This experience echoes embedded coder challenges faced by a similar program in Kenya. Overall, participants shared honestly and openly about successes and failures and advocated for more “Fail Faire” type events where practitioners share knowledge and experiences not only with each other but also with donors.

These were the overall conclusions:

  1. Sustainable data journalism activities require the buy-in of journalists, developers, editors and publishers
  2. Finding good matches between media outlets, CSOs and developers all committed to data are key to productive collaborations
  3. How people consume information should dictate narrative or visual form of data products
  4. Data journalism requires teamwork, whether inside or outside of the newsroom
  5. Mentoring and consulting data experts can help avert mistakes in data analysis and interpretation
  6. Storytelling to convey data helps people understand and connect with the issue
  7. Not a lot of resources are available for data journalism tailored to developing country contexts
  8. Data integrity is an emerging issue of concern as data journalism increases in popularity
  9. Topics, projects or specific production goals can help make data journalism activities more realistic and achievable
  10. Sharing lessons learned is essential to designing more effective data journalism activities

To learn more about how to design data journalism initiatives in developing countries, check out the session Etherpad and my blog post for Knight Mozilla Open News Source on Developing Data Journalists in the Developing World.

Flattr this!

Use of news apps on the rise in the newsroom

- August 14, 2014 in Data Journalism

Business Daily's 2014-15 budget tree map

A tree map created for Business Daily by Daniel Cheseret.

This post is cross-posted from the Internews Kenya blog

Business Daily's NSSF deduction calculator

Business Daily’s NSSF deduction calculator.

To call it a wind of change would probably be puffery, but a slow breeze is blowing through newsrooms in Kenya, increasing the interest in data journalism and the demand for news applications.

Kenyan media houses have in the past couple of years enjoyed several collaborative project aimed at promoting data journalism and encouraging innovative use of online platforms such as Code for Kenya and data journalism trainings and fellowships offered by Internews in Kenya

But up until now however, only a few journalists have shown interest in data journalism and the media houses themselves have not developed news applications of their own – on their own.

But lately Business Daily, a weekly magazine published by the Nation Media Group, has moved into the new frontier – publishing both a news application and an interactive chart on their website within a week.

In preparation of the 2014-15 budget reading, Business Daily commissioned developer Daniel Cheseret to make them an interactive chart showing the breakdown of the budget. Cheseret was a 2013 Internews data journalism fellow, wasted no time and as the budget went public the magazine could showcase a beautiful tree map on their website.

“The online desk’s interest in data journalism is growing, I’m currently working on another project for them that will be published soon” says Cheseret.

Recently he also built a news application for the magazine, where the readers can calculate how much of their monthly salary will go to The National Social Security Fund as the scheme for the deductions will change in the upcoming four years.

Kenyan journalists and developers at large are also showing more enthusiasm for data journalism. When Data Driven Journalism recently offered an MOOC (Massive Open Online Course) in data journalism more than a hundred Kenyans signed up for the class. Internews in Kenya was one of the local learning groups during the course.

Flattr this!

How to: Choropleth Maps with D3

- June 6, 2014 in Data Journalism, Geocoding, HowTo, Mapping, maps


[Guest Cross-post from Jonathon Morgan of Crisis.net. CrisisNET finds, formats and exposes crisis data in a simple, intuitive structure that’s accessible anywhere. Now developers, journalists and analysts can skip the days of tedious data processing and get to work in minutes with only a few lines of code. See the Original post]

syriamapcut

D3 is quickly become the de facto library for browser-based data visualizations. However while it’s widely used for line graphs and bar charts, its mapping features are still fairly underutilized — particularly in relation to more established tools like CartoDB, and of course Google Maps. Those tools have their place, but when you need fine-grained control over the presentation and interactivity of your geospatial data, D3 can be a powerful alternative.

Today we’ll walk through how to create a popular visualization; the choropleth map. These are used to show the relative concentration of data points within a given region. For example this might be the number of people within a particular age range in every county in a state, or the number of reported cases of the flu in each state in a country. The information we’ll be mapping is a little more exotic. I recently collaborated with Eliot Higgins, an arms transfer analyst focused on the ongoing conflict in Syria, to retrieve data from 1,700 Facebook pages and YouTube accounts associated with militant groups and humanitarian organizations working in Syria. We ingested that data into CrisisNET, which then made it possible for us to generate a “heat map” showing which parts of Syria are experiencing the most intense fighting.

In order to do this we’ll need to:

  • Work with projections to transform latitude, longitude pairs to x, y browser coordinates
  • Render city boundaries as SVG paths using D3 drawing tools
  • Shade each city relative to its reported level of violence

Let’s get started.

Before we can do anything we’ll need some data. A geospatial “feature” (like a city, state, etc), is defined as a polygon, which is represented as a list of latitude/longitude pairs. For example:

[
[ 36.712428478000049, 35.83274311200006 ],
[ 36.704171874000053, 35.830347390000043 ],

]

Each pair is a corner of the polygon, so if you plotted them on a map and connected the dots, you would get the outline of the feature. Awesome!

Geospatial data comes in a variety of formats, like shapefiles, and KML. However the emerging standard, particularly for use in web applications, is GeoJSON. Not surprisingly, this is the format supported by D3 and the one we’ll be using.

Depending on the region you’re trying to map, GeoJSON polygons defining features in that region may be easy to find — like these GeoJSON files for all counties in the United States. On the other hand, particularly if you’re interested in the developing world, you’ll probably need to be more creative. To map cities in Syria, I tracked down a shapefile from an NGO called Humanitarian Response, and then converted that shapefile to GeoJSON using a tool called ogr2ogr. Fortunately for you, I’ve made the GeoJSON file available, so just download that and you’ll be ready to go.

Let’s Talk Projections

With our polygons in hand, we can start mapping.

Remember that latitude and longitude coordinates denote positions on the surface of the Earth, which is not flat (it is an ellipsoid). Your computer screen is a plane (which means it’s flat), so we need some way to translate the position of a point on a curved surface to its corresponding point on a flat surface. The algorithms for doing this are called “projections.” If, like me, you’ve forgotten most of your high school geometry, you’ll be pleased to learn that D3 comes included with a number of popular projections, so we won’t need to write one. Our only job is to choose the correct projection for our visualization.

The Albers and Azimuthal Equal Area projections are recommended for choropleth maps, but I found both rendered my cities in a way that didn’t connect all the points in the polygons from our shapefile, so some of the city outlines didn’t form an enclosed shape. This made it impossible to shade each city without the color overflowing into other parts of the map. Although this is probably due more to my lack of familiarity with the specifics the Albers and Azimutha projections, I found that the Conic Conformal projection worked out of the box, so that’s the one I chose.

Drawing the Map

Now that you understand the background, we can start coding. First, attach an element to the DOM that will serve as our canvas.

Next create an SVG element and append it to the map DOM node we just created. We’ll be drawing on this SVG element in just a second.

// Size of the canvas on which the map will be rendered
var width = 1000,
height = 1100,
// SVG element as a JavaScript object that we can manipulate later
svg = d3.select(“#map”).append(“svg”)
.attr(“width”, width)
.attr(“height”, height);

Despite the rather lengthy explanation, defining the projection in our application is actually fairly straightforward.

// Normally you’d look this up. This point is in the middle of Syria
var center = [38.996815, 34.802075];

// Instantiate the projection object
var projection = d3.geo.conicConformal()
.center(center)
.clipAngle(180)
// Size of the map itself, you may want to play around with this in
// relation to your canvas size
.scale(10000)
// Center the map in the middle of the canvas
.translate([width / 2, height / 2])
.precision(.1);

With a projection ready to go, we’re ready to instantiate a path. This is the path across your browser window D3 will take as it draws the edges of all our city polygons.

// Assign the projection to a path
var path = d3.geo.path().projection(projection);

Finally, let’s give some geospatial data to our path object. This data will be projected to x, y pairs, representing pixel locations on our SVG element. When D3 connects these dots, we’ll see the outlines of all the cities in Syria.

Let’s use d3’s json method to retrieve the GeoJSON file I referenced earlier.

d3.json(“cities.json”, function(err, data) {
$.each(data.features, function(i, feature) {
svg.append(“path”)
.datum(feature.geometry)
.attr(“class”, “border”);
});
});

That’s it!

Most of the heavy lifting is taken care of by D3, but in case you’re curious about what’s happening, here’s a little more detail. Our GeoJSON file contains an array of features, each of which is a polygon (which is represented as an array of longitude, latitude coordinate pairs). We pass the polygon to our path using the datum method, and the polygon is then converted by our projection to a linestring of pixel positions which is used by the browser to render a path DOM node inside our svg element. Phew.

With a working map of the country, we can now change its appearence and add interactivity just like any other DOM node. Next week we’ll use the CrisisNET API to count reports of violent incidents for each city in Syria, and shade each city on the map with CSS based on those report counts.

In the meantime you can checkout the full, working map on our Syria project page.

Flattr this!

Greek Data Expedition and Data Journalism

- May 26, 2014 in Community, Data Expeditions, Data Journalism, School_Of_Data

[Guest post by Charalampos Bratsas, School of Data, Greece. See more details on the School of Data Greece blog..]

The Open Knowledge Foundation of Greece “OKF Greece” in collaboration with the Masters Program “Web Science Studies” of Mathematics Department and the postgraduate Masters Program “Journalism & New Media” of Journalism & Mass Media Department of Aristotle University of Thessaloniki, presented the first attempted results of writing articles based on data journalism.

Students of both departments, divided into groups, cooperated in order for “Web Science” postgraduate students to seek data, analyze and visualize them, while Journalists processed the available correlations to create a data based article.

Through the aforesaid collaboration three data based articles emerged:

As well, the following infographic was created: “European Student Mobility in the period 2001-2012“.

About Data Journalism

This is a new, promising kind of journalism, which takes advantage of the possibilities offered by new technologies. It uses a variety of different digital data and correlations of information while maintaining the traditional way of tracking issues, highlighting the emerging news and issues that are worthy of publishing.

Further clarifying information can be found in Greek edition of the “Data Journalism Handbook” published by the Open Knowledge Foundation of Greece, the Media Informatics Lab of Journalism & Mass Media Department, and the postgraduate Program in Web Science.

It should be emphasized that the upcoming academic year, data journalism will be taught in the undergraduate curriculum of Journalism & Mass Media Department by Professor Andreas Veglis and Dr. Charalambos Bratsas. Students will have the opportunity to learn the fundamentals, as well as the tools of data journalism, as highlighted in the manual “Data Journalism”.

An example from the session:

European-Student-Mobility

You can stay informed of Open Data topics in Greece on the OKFN Greece website.

Flattr this!