You are browsing the archive for Infoskills.

Women’s Rights Campaigning: Info-Activism Toolkit

- October 15, 2014 in Infoskills

dtm_201307

Tactical Tech

This post was written by Lisa Gutermuth, a project coordinator at Tactical Tech in Berlin. Currently she is working producing the Women’s Rights Campaigning: Info-Activism Toolkit. She has previously focused on land grabbing, crowdmapping, and e-waste for different projects at Tactical Tech and with affiliated organisations.

Tactical Tech is an organisation working to advance the skills, tools and techniques of rights advocates, empowering them to use information and communications to help marginalised communities understand and effect progressive social, environmental and political change.


Trying to figure out how to present evidence of violence in a creative way? A campaign by the India-based Blank Noise project offers us an example of how this can be done.

In most parts of the world, a widely-used tactic to discredit women victims of violence is to accuse them of ‘asking for it’ by dressing provocatively. Blank Noise started a campaign called ‘I Never Ask For It’, in which women who had experienced street based sexual harassment were asked to send in photos of the garments that they were wearing when they experienced the harassment. Unsurprisingly, the database of photos was mostly comprised of pictures of school uniforms, burqas, traditional salwar kameez, saris, and jeans and so on: nothing provocative about any of this. These images highlight the very personal side of harassment, while simultaneously creating an understanding among women that they are not alone, as well as working toward wider debate about these kinds of events.


foto1tt


This is one of the examples found in the Women’s Rights Campaigning: Info-Activism Toolkit developed by Tactical Tech.

The toolkit is created for women’s rights activists, advocates, NGOs and community-based organisations who want to use technology tools and practices in their campaigning. The guide was developed as part of CREA‘s New Voices / New Leaders: Women Building Peace and Reshaping Democracy project, which aims to promote security by combating violence against women and enhancing the civil engagement of women in the Middle East, North Africa, South Asia and Sub-Saharan Africa.


foto2


This guide is also a good example of an older project being ‘upcycled’ into something new, updated and relevant to a specific community. The original guides we produced were called Message in-a-Box and Mobiles in-a-Box. CREA, a women’s rights organisation in India, initially approached us to update and customise our toolkits for women’s rights communities.

This gave us a chance to think about a structure and format that would work, and respond to the actual context of how specific communities think about campaigning. Each of the categories included in the guide was carefully considered in the development stages of the project, both because there was a focused community for whom it was being created, and because we had regular feedback from our local partner organisations.

The next step was translating the guide into Hindi, Bengali, Kiswahili, and Arabic. At Tactical Tech we make an effort to integrate localisation into our materials by providing options and resources for translations, as this enables communities to identify more closely with the contents and to read and use it at a more in-depth level. This is also why having the materials printed (i.e. offline) was such an important part of the project, as the communities that need the entry point to learning about the positive use of digital tools are often those most far away from them.

Which brings us to the latest development: the printed toolkits are just off the press! The guide has been printed as a set of four booklets: ‘Basics,’ ‘Grab Attention,’ ‘Tell a Story,’ and ‘Inspire Action,’ representing different strategic themes to use in creating a campaign. The next phase will be distribution – sign up to Tactical Tech’s monthly magazine In the Loop  for updates!


foto3

Flattr this!

Working With Large Text Files – Finding UK Companies by Postcode or Business Area

- December 5, 2013 in HowTo, Infoskills

A great way of picking up ideas for local data investigations, whether sourcing data or looking for possible story types, is to look at what other people are doing. The growing number of local datastores provide a great opportunity for seeing how other people are putting to data to work and maybe sharing your own investigative ideas back.

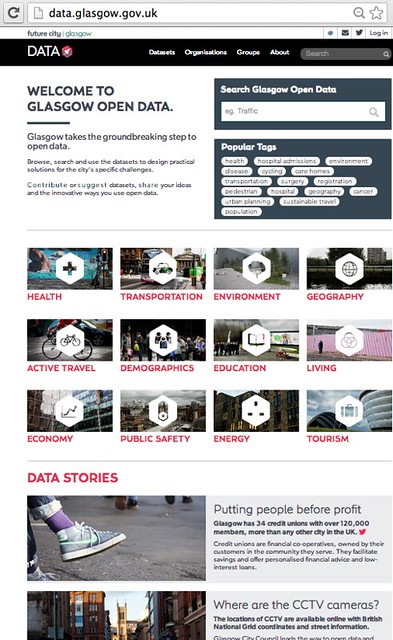
A couple of days ago I was having a rummage around Glasgow Open Data, which organises data set by topic, as well as linking to a few particular data stories themselves:

Glasgow Open Data - data.glasgow.gov.uk

One of the stories in particular caught my attention, the List of Companies Registered In Glasgow, which identifies “[t]he 30,000 registered companies with a registered address in Glasgow.”

The information is extracted from Companies House. It includes the company name, number, category (private limited, partnership), registered address, industry (SIC code), status (ex: active or liquidation), incorporation date.

Along with the Glasgow information is a link to the original Companies House site (Companies House – Data Products) and a Python script for extracting the companies registered with a postcode in the Glasgow area.

It turns out that UK Companies House publishes a Free Company Data Product “containing basic company data of live companies on the register. This snapshot is provided as ZIP files containing data in CSV format and is split into multiple files for ease of downloading. … The latest snapshot will be updated within 5 working days of the previous month end.”

The data is currently provided as four compressed (zipped) CSV files, each just over 60MB in size. These unpack to CSV files of just under 400MB each, each containing approximately 850,000 rows, so a bit over three million rows in all.

Among other things, the data includes company name, company number, address (split into separate fields, including a specific postcode field), the company category (for example, “private limited company”), status (for example, whether the company is active or not), incorporation date, and up to four SIC codes.

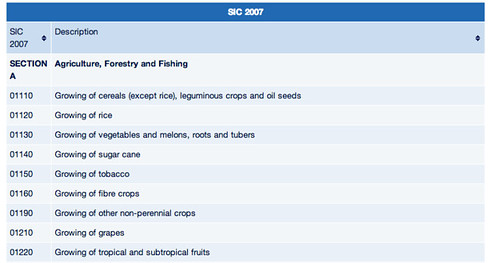
The SIC codes give a description of the business area that the company is associated with (a full list can be found at Companies House: SIC 2007).

SIC Codes

Given that the downloadable Companies House files are quite large (perhaps too big to load into a spreadsheet or text editor), what can we do with them? One approach is to load them into a database and work with them in that environment. But we can also work with them on the command line…

If the command line is new to you, check out this tutorial. If you are on Windows, will you need to install something like Cygwin.

The command line is a place where we can run powerful commands on text files. One command in particular, grep, allows us to run through a large text file and pull out just those rows whose contents, at least in part, match a particular pattern.

So for example, if I open the command line and navigate to the folder that contains the files I want to process (for example, one of the files I downloaded and unzipped from Companies House, such as BasicCompanyData-2013-12-01-part4_4.csv), I can create a new file that contains just the rows in which the word TESCO appears:

grep TESCO BasicCompanyData-2013-12-01-part4_4.csv > tesco.csv</tt>

We read this as: search for the pattern “TESCO” in the file BasicCompanyData-2013-12-01-part4_4.csv and send each matching row (>) into the file tesco.csv.

Note that this search is quite crude: it looks for an appearance of the pattern anywhere in the line. Hence it will pull out lines that include references to things like SITESCOPE LIMITED. There are ways around this, but they get a little bit more involved…

Thinking back to the Glasgow example, they pulled out the companies associated with a particular upper postcode area (that is, by matching the first part of the postcode to upper postcode areas associated with Glasgow). Here’s a recipe for doing that from the command line.

To begin with, we need a list of upper postcode areas. Using the Isle of Wight as an example, we can look up the PO postcode areas and see that Isle of Wight postcode areas are in the range PO30 to PO41. If we create a simple text file with 12 rows and one postcode area in each row (PO30 on the first row, PO31 on the second, PO41 on the last) we can use this file (which we might call iw_postcodes.txt) as part of a more powerful search filter:

grep -F -f iw_postcodes.txt BasicCompanyData-2013-12-01-part1_4.csv  >> companies_iw.txt

This says: search for patterns that are listed in a file (grep -F), in particular the file (-f) iw_postcodes.txt, that appear in BasicCompanyData-2013-12-01-part1_4.csv and append (>>) any matches to the file companies_iw.txt.

We can run the same command over the other downloaded files:

grep -F -f iw_postcodes.txt BasicCompanyData-2013-12-01-part<strong>2</strong>_4.csv  >> companies_iw.txt
grep -F -f iw_postcodes.txt BasicCompanyData-2013-12-01-part<strong>3</strong>_4.csv  >> companies_iw.txt
grep -F -f iw_postcodes.txt BasicCompanyData-2013-12-01-part<strong>4</strong>_4.csv  >> companies_iw.txt</tt>

(If it is installed, we can alternatively use fgrep in place of grep -F.)

We should now have a file, companies_iw.txt, that contains rows in which there is a match for one of the Isle of Wight upper postcode areas.

We might now further filter this file, for example looking for companies registered in the Isle of Wight that may be involved with specialist meat or fish retailing (such as butchers or fishmongers).

How so?

Remember the SIC codes? For example:

47220   Retail sale of meat and meat products in specialised stores
47230   Retail sale of fish, crustaceans and molluscs in specialised stores

Can you work out how we might use these to identify Isle of Wight registered companies working in these areas?

grep 47220 companies_iw.txt >> iw_companies_foodies.csv
grep 47230 companies_iw.txt >> iw_companies_foodies.csv

(We use >> rather than > because we want to append the data to a file rather than creating a new file each time we run the command, which is what > would do. If the file doesn’t already exist, >> will create it.)

example data - grepped foodshops

Note that companies may not always list the specific code you might hope that they’d use, which means this search won’t turn them up—and that as a free text search tool, grep is quite scruffy (as we saw with the TESCO example)!

Nevertheless, with just a couple of typed commands, we’ve managed to search through three million or so rows of data in a short time without the need to build a large database.

Flattr this!

An Introduction to Mapping Company Networks Using Gephi and OpenCorporates, via OpenRefine

- November 15, 2013 in Infoskills, OpenRefine, recipe

As more and more information about beneficial company ownership is made public under open license terms, we are likely to see an increase in the investigative use of this sort of data.

But how do we even start to work with such data? One way is to try to start making sense of it by visualising the networks that reveal themselves as we start to learn that company A has subsidiaries B and C, and major shareholdings in companies D, E and F, and that those companies in turn have ownership relationships with other companies or each other.

But how can we go about visualising such networks?!

This walkthrough shows one way, using company network data downloaded from OpenCorporates using OpenRefine, and then visualised using Gephi, a cross-platform desktop application for visualising large network data sets: Mapping Corporate Networks – Intro (slide deck version).

The walkthrough also serves as a quick intro to the following data wrangling activities, and can be used as a quick tutorial to cover each of them.

  • how to hack a web address/URL to get data-as-data from a web page (doesn’t work everywhere, unfortunately;
  • how to get company ownerships network data out of OpenCorporates;
  • how to download JSON data and get it into a nice spreadsheet/tabular data format using OpenRefine;
  • how to filter a tabular data file to save just the columns you want;
  • a quick intro to using the Gephi netwrok visualisation tool;
  • how to visualise a simple date file containing a list of how companies connect using Gephi;

Download it here: Mapping Corporate Networks – Intro.

So if you’ve ever wondered how to download JSON data so you can load it into a spreadsheet, or how to visualise how two lists of things relate to each other using Gephi, give it a go… We’d love to hear any comments you have on the walkthrough too, (what you liked, what you didn’t, what’s missing, what’s superfluous, what worked well for you, what didn’t and most of all – what use you put to anything you learned from the tutorial!:-)

If you would like to learn more about working with company network data, see the School of Data blogpost Working With Company Data which links to additional resources.

Flattr this!

Climbing the d3.js Visualisation Stack

- August 12, 2013 in Data Blog, Infoskills, Visualisation

Over the last few months, the d3.js Javascript visualisation library has seen widespread use as the powerhouse behind a wide variety of highly effective interactive data visualisations. From the Sankey diagram we used to visualise horse meat exports in the EU, to Anna Powell Smith’s funnel plots generator, to the New York Times’ 512 Paths to the Whitehouse, d3.js provides a rich framework for developing an increasingly rich panoply of data driven animated graphics.

Despite the growing number of books and tutorials that are springing up around the library, such as Data-Driven Documents, Defined on the Data Driven Journalism site, creating even the simplest charts using d3.js out of the box can prove a major challenge to those of us who aren’t fluent in writing Javascript or manipulating the DOM (whatever that means!;-)

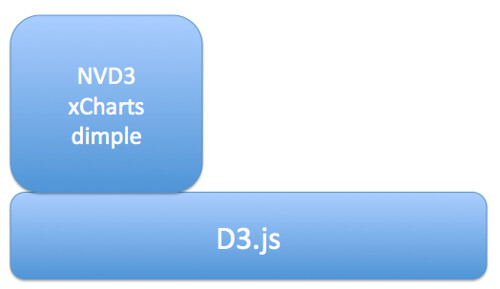
d3jsStack-base

Help is at hand, though, in the form of several libraries that build on top of d3.js to provide a rather more direct path between getting your data into a web page and displaying it. Here are a few of the ones I’ve come across:

  • NVD3 – one of the more mature libraries, includes line charts, scatterplots (and bubble charts), bar charts (grouped or stacked), stacked area charts
  • xcharts – nicely animated line charts and bar charts
  • dimple.js – “aims to give a gentle learning curve and minimal code to achieve something productive”
  • Vega, “a visualization grammar, a declarative format for creating, saving and sharing visualization designs”. I think this probably sits somewhere between basic chart types and d3.js, so whilst it’s a step-up from d3.js, it’s not quite as “high level” as NVD3 and xcharts, for example.

d3jsstack-helper

The aim of these libraries is to wrap the lower level d3.js building blocks with function calls that allow you to call on preconfigured chart types, albeit corresponding to familiar charts.

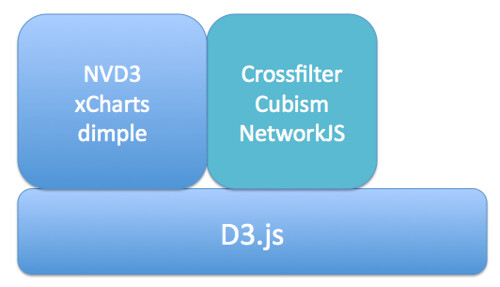
Further up the abstraction layer, we have more specialised Javascript libraries that provide support for complex or compound chart types:

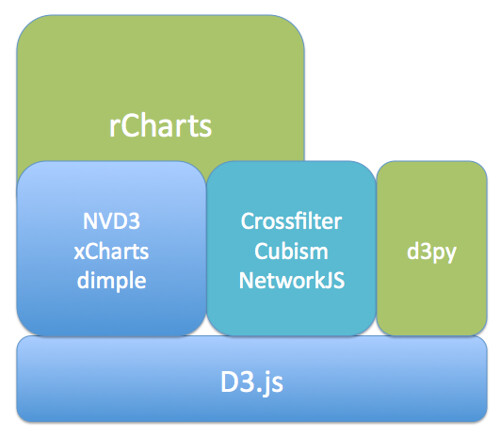
d3jsStack-specialised

  • Crossfilter – explore large, cross-linked multivariate datasets in the browser
  • cubism.js – produce scalable, and realtime animated, time series visualisations
  • JSNetworkX – a library that builds on several other toolkits and approaches, including d3.js, to provide a library that support the construction, manipulation and display of networks in the browser.

If programming in Javascript, even at these higher levels, is still not something you think you can cope with, there are several other alternatives that build on d3.js by generating templated web pages automatically that make use of your data:

d3jsStack-templater

  • rCharts – generate a wide range of charts using d3.js helper libraries, as well as non-d3.js Javascript libraries, from within an R environment such as RStudio. (It’s extensible too.) The latest release also allows you to create dynamic visualisations using automatically populated control elements.
  • d3py – generate d3.js powered webpages from Python using the Pandas library

If you want to create your own, novel visualisation types, then d3.js provides a great toolkit for doing so. If you are a confident web developer, you may still find it more convenient to use one of the abstraction libraries that offer direct axis to basic chart types built up from d3.js components. If you need access to more specialised chart types, things like Crossfilter, Cubism or NetworkJS may suit your needs. If you don’t class yourself as a web developer, but you can handle Python/Panda or are willing to give R a go, then the HTML and Javascript generating d3py and rCharts will do pretty much all the heavy lifting for you.

So – what are you waiting for…? Why not have a go at generating one of your own interactive browser based visualisations right now…:-)

Flattr this!