Documenting Egypt’s Elections Results
With the unfolding events in Egypt, the debate about whether the country is witnessing a coup or a second revolution in less than three years, and the cover of Time magazine tagging the country as the “World’s Worst Democrats”, some might argue that this is not a suitable time to write about grassroots approaches to document election results. In fact, in such an environment, especially in a country that lacks a history of free and fair elections, it is needed to shed light on efforts made by individuals to battle the existing obstacles and to share this experience with others that could take it further into the future.
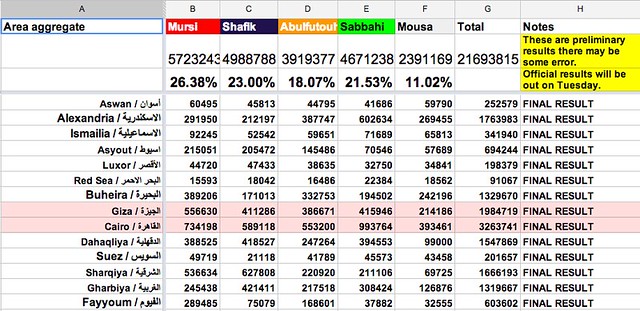
In the summer of 2012, Egypt had its first post-revolution presidential elections. This was also the country’s first free and fair election in its entire history. Just like everybody there, the local media was not used to covering or documenting elections. Each TV channel or newspaper had a few representatives only in some of the centres where votes were being counted. They followed the process and announced the results once they got them. But the problem was that no one was summing up the results. Additionally, the results being announced were limited to those locations where media representatives were present. Seeing this, Iyad El-Baghdadi and six other Twitter users created a shared spreadsheet and started adding the results there, using the numbers being announced on TV or circulated on social media. According to Iyad, the differences between the results in their sheet and the official ones announced later were less than 1%. So, I decided to ask him for more details about their workflow and how they acquired the numbers.

When it comes to the voting results, Iyad told us that they relied mainly on the results announced by the media, especially news websites, such as Al-Shorouk, Al-Masry Al-Youm, etc. He added that they ignored politically leaning sources. Data published was mainly raw data, and it needed lots of organization and validation from their side. Hence, their workflow was as follows. They set a Google spreadsheet where each contributor had to mention the source of his numbers alongside the numbers themselves. They also agreed on some standards. Uncertain or preliminary data were to be written in italics. When done with a governorate (state), numbers were summed up and then made bold and grey. The person doing the calculations had to list his name next to the calculations. They used the chat feature extensively to resolve conflicting numbers and ask for data validation when needed. The vote counting process took about 30 to 36 hours, so they organised themselves in shifts, benefiting from the fact that the team members were living in different time zones. They repeated the same process again for the runoff results.
Iyad and his team sure gained some experience from similar attempts that took place earlier. Evan Hill (@evanchill), a foreign journalist based in Cairo, collaborated with Hany Rasmy (@hany2m), an Egyptian Twitter user, a few months earlier, to collect and validate the parliamentary election results. The parliamentary elections took place in three stages, between late 2011 and early 2012. The Egyptian governorates were divided among the three stages. Evan and Hany set three separate spreadsheets for each of them. They plotted graphs for the results within their sheets, whereas Iyad told us that some people visualised their data separately.
We finally asked Iyad if he has any tips for anyone who might like to undertake similar work later on. He said that one of the most important things to pay attention to is the spreadsheet’s structure and organization. The more structured it is, the easier it is for participants to collaborate. He also added that the overall process has to be simple, with no technical complexities, however there should be a clear workflow and sort of tradition for participants to follow. The ones moderating the process should act in a professional way, guide others, and make sure no one is there just wasting others’ time or joking. Making the resulting data both human and computer readable encourages others to build on it and produce more in depth analysis and visualisations.


Leave a Reply