You are browsing the archive for #mozfest.

School of Data Goes to MozFest 2014 ! – Part 2

- October 31, 2014 in Data Expeditions, Events

Part 2 of our MozFest recap: check out the first blog post for our Day 1 adventures…

Third Day Recap – Second School of Data Session!

After our first successful session, the School of Data team went in excitedly for the second session on Day 3! The floors were packed in the morning because the organizers made the surprising decision of giving (we think everyone) who attended the Mozilla Festival a Firefox OS Flame phone. A sweet phone, which caused long queues in the Ravensbourne building.

With the sessions now in full steam, the second School of Data session was scheduled in the afternoon, and we brought a familiar School of Data format: that is, the data expedition! The theme for today session is “Analysing Data Using Spreadsheets”, and we went ahead, data sherpa style!

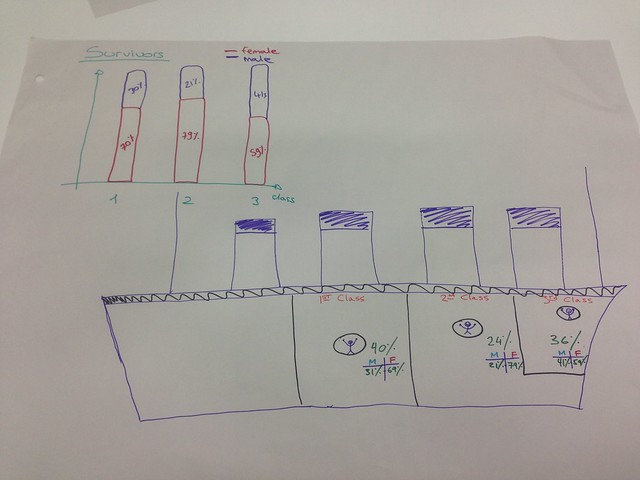
The theme chosen for this data expedition session was all about the re-enacting the Titanic. We provided data on the passengers of the Titanic, and from there we tried to work the data through the familiar School of Data data pipeline. We split the participants into two groups based on the operating system that they use, and then we started hacking! We started by first using a lot of post it notes to try finding questions that we could answer using the data, and after that we used spreadsheet tools such as Excel to find some answers, and last but not least, visualize those answers.

We had an interesting mix of participants in this session, with some them having already worked with spreadsheets a lot, which led to the wonderful situation where participants were teaching with other about various things such as pivot table techniques, formulae, and even the super useful but hard to notice text to column button in Excel (and we also learn new things too) – as following the collaborative learning spirit of Mozilla Festival.

In the end, this is what we made : A visualization of titanic, showing the survival rate of the passengers, separated by gender and passenger class. Really nice expedition :)

School Of Data @ Mozilla Festival London

Flattr this!

I see “Dead” Data @ Mozfest

- October 28, 2013 in Community, Data Expeditions

[Cross-posted from TextonTechs (blog) by Heather Leson. Mozilla Festival was held in London UK on October 26 – 27, 2013]

We are all teachers of the Open Web. The School of Data team with 28 participants are Learning how to run at Data Expedition at Mozilla Festival.

dataexped

Data and knowledge need to be activated. People are often intimated by data, so our goal is to teach a world of data makers. We’ve divided into 4 teams consisting of storytellers, analysts, engineers, scouts and designers are doing a fast-paced exercise in expeditions. We will take “dead” data and activate it. The experience is to help others teach data expeditions.

Using Immigration Data to Learn about Data Expeditions

We’ve collected 3 different datasets about immigration data. The teams are reviewing it and determining stories and potentially activation methods. (eg. maps, diagrams)  One team is analyzing datasets to determine the number of deaths of people attempting to migrate from Africa to Europe. Another team is using the data to show the true costs and benefits of immigration to the UK. Using Cartographe team 3 is building a map of countries that are difficult to travel. Comparing economic data and visa requirements is the mission of the fourth team.

team

Outcomes /Learnings

ib

Created by Berto

  • Leave the exercise raw. This opens us up to new ideas and potentially minimizes assumptions
  • Always save your projects (One team lost their work)
  • Build a clear problem analysis before going down the data or tool rabbit hole
  • Be aware of simplifying data and what context you might lose

About the data:

Are you Data Curious? How would you activate this data?

Anyone can participate in this data expedition. The full details and collaboration space about the Mozfest data on Etherpad. Be a Data Expeditioner Too!

Anyone can be a data maker. How can we get to the next 100, 000 data makers teaching and sharing data stories?

Flattr this!