Identifying Pieces in the Spending Data Jigsaw
Tony Hirst - August 6, 2013 in OpenSpending
Despite there being increasing amounts of spending data being published by public bodies around the world, there still seems to be considerable confusion about how to work with it in support of transparency aims. Services such as OpenSpending and Armchair Auditor provide a variety of tools for searching datasets and visualising spend within different service areas, but if we’re more interested in a taking a bottom-up view of the data by looking at individual spending transaction records, where should we start?
As we lean forward from our armchairs as volunteer auditors, what other pieces in the spending information jigsaw might we start to look for, and how might we be able to piece them together? Here are a few ideas about some of the things we might look out for, along with some salutary warnings about misreading the data alongside them…
An early review of the Armchair Auditor from June 2010 – Armchair Auditor – Local Council Payments – describes how you can identify payments made to particular companies within a spending area, as well as using a simple search string to identify payments that may be made to separate companies within a particular corporate group. A search over one dataset for “capita” identifies “Capita Business Services Ltd”, “Capita Education Resourcing” and “Capita Education Services Ltd”, among others, which we might imagine are related.
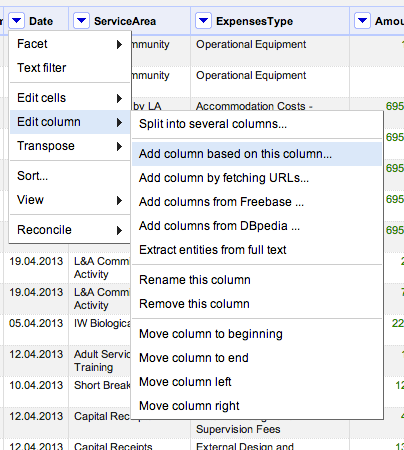
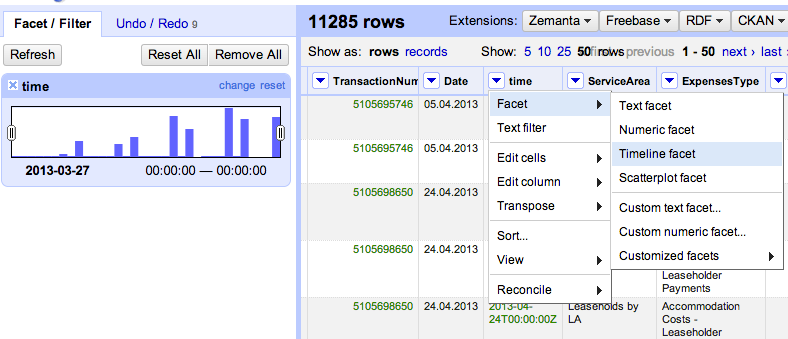
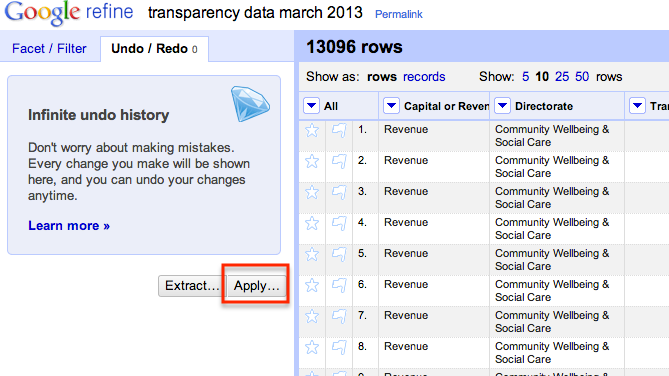
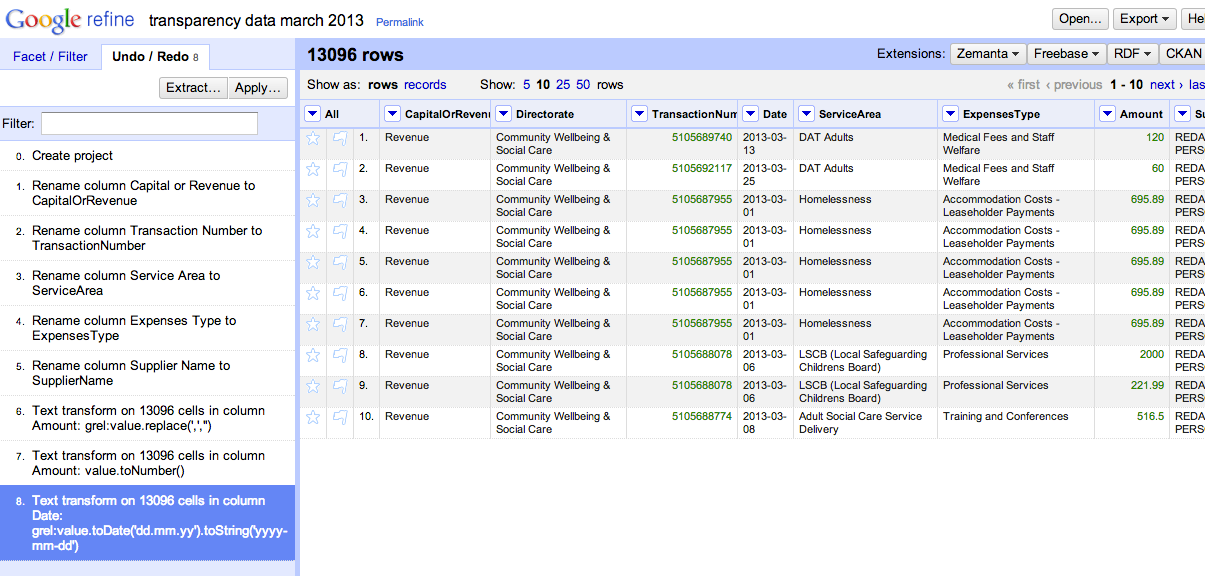
Such an approach might be extended using the clustering tools in data cleaning applications such as OpenRefine, or by associating company names with corporate identifiers and registered addresses. For example, by reconciling company names against companies and corporate groupings listed in OpenCorporates, we may be able to start identifying the total spend with particular corporate groups as well as with the individual (and distinct) companies within the group. If information about company directors is also available, we can also start to look for payments to companies that have the same directors, even if they are not apparently members of the same corporate grouping, or for payments to companies whose directors include council members.
Another simple approach we might take is to search for particular keywords amongst the spending information. In a Guardian blogpost from July 2011 – Mrs Angry: how to be an armchair auditor – Patrick Butler suggests the following:
Almost all councils in England now publish details of expenditure over £500, but it is up to you to trawl through the raw data and analyse its significance.
What is missing from the accounts is as important as what is listed: “sensitive” payments may have names redacted, and you should query such entries.
Be creative: Mrs Angry is perhaps too easily distracted by opportunities for mischief, but searching for entries such as “hotel,” “conference,” or “training,” provides her with plenty of blogging fun…
In a related post, Armchair audit: sense and nonsense, the Reluctant Armchair Auditor also warns against frivolous searches, noting that “the trouble is that you get tempted into having some fun with minutiae”. He also expresses concern about whether there is anything useful we can actually do with transactional local spending data purely on its own merits:
Putting all this nonsense to one side the most important question is whether this sort of publication enables armchair auditors (reluctant or otherwise) to do the job government thinks they can. The answer has got to be “not yet”.
For this to work in the way envisaged, councils must put out a lot more information and in a format that can be used by anyone. There has to be sufficient context to enable anyone reading the information to understand what is being bought and why. Then you can have a sensible discussion about whether the spending makes sense or is value for money. We can then deal with the material figures not the trivial ones which cause most of the negative publicity.
As David Higgerson illustrates in The Council which treats armchair auditors like prisoners of war,
…for the armchair auditor, seeing a taxi firm being paid £2,000 in one month doesn’t tell them that the council leader is getting a personal taxi service any more than it tells them that it could be a bill for ferrying children in care to school. Or indeed, any other of the many reasons why a council might employ the services of a taxi firm.
A UK Audit Commission discussion paper from March 2010 (The truth is out there: Transparency in an information age) also stressed the limitations associated with reviewing spending data in the absence of additional context:
But is this type of transparency [publication of spending data] enough to enable the public to scrutinise and challenge local spending? Seeing what a council is paying to contractors is clearly a good starting point. It tells the public what is being spent, when and who is being paid. But it also has limitations. To challenge contractor spending effectively the public would also need to know:
– what the money spent on;
– was the expenditure justified;
– did it deliver value for money; and
– what impact did it have locally?And contractor data alone is not enough to draw conclusions about where good value for money is being secured. Anyone trying to make such a judgement would need significant additional information, including whether a service and its objectives were the same in different areas, and whether councils provide it in-house or contract it out.
One of the challenges, then, for the armchair auditor is to identify additional contextual materials that can help us interpret what the spending data on its own appears to be telling us. On the other hand, there may be patterns within the payments themselves that may allow us to contextualise certain elements of the spending data.
For example, a UK Government Procurement Service contract on “Spend Analysis and Recovery Services” identifies a range of services that might prompt an armchair auditor in action, such as “analys[ing] accounts payable data, looking for duplicate payments, overpayments and other forms of erroneous spend.” Looking for search terms such as “refund” or “overpayment” might identify some such payments, as might looking for “negative” payments. If explicitly identified overpayments, or negative (incoming) payments of a balanced amount compared to outgoing payments, are regularly made to the same supplier, there might be an opportunity to ask a pointed question regarding such payments. Searching for duplicate payments (or payments that are an order of magnitude away from each other, such as 21.63 compared to 216.30) might also turn up interesting patterns in the data.
The GPS contract also identifies two other analysis areas that may be relevant armchair auditors:
- Spend Analytics Services – a full review of procurement and supply chain processes, looking to identify areas to deliver efficiencies and process savings by assessing spend profile, procurement processes, [and] use of framework agreements … to deliver efficiency savings. For the armchair auditor, this might include searching for repeated payments to the same supplier, and in particular payments of the same amount, and the schedule they appear to follow. This sort of analysis may also help identify the presence of ongoing contracts with particular suppliers (as well as setting up opportunities for detecting when a contract in a particular spending area is cut year on year, for example).
- If we start reconciling payments data with procurement or contracts information, civic watchdogs may also be in position to start exploring Contract Compliance Analysis: an analysis of supply chain contracts, looking to identify areas for process savings to deliver real cash savings by analysing contractual clauses such as price breaks. The contract compliance analysis can be undertaken as part of the wider spend analysis and recovery, and can include a price compliance (i.e. an analysis of every contract against each invoice line), or as a standalone activity.
The OECD Money Laundering Awareness Handbook for Tax Examiners and Tax Auditors hints at several other patterns in payments that we might care to look out for:
- Significant increase in [spend];
- Large cash payments received for goods[/services] never delivered (fictitious buyer)
- Transactions without an evident commercial basis or supporting documentation on file
- Transactions and agreements without related costs or relevant supporting documentation
- Transactions with suspected criminals or their partners
- Transactions in goods or services not fitting company’s profile
- [Transactions with newly formed [or dissolved] companies]
- Unusual service provided by a professional service provider
- Unusual professional service provider chosen for service
- Unusual reward for a professional service provider
- Unusual transaction, income or assets of the professional service provider
We might revise some of these statements with a particular emphasis on the spending context. For example, in the case of a local council, we might query spend within in a particular spending area to a company not typically associated with that spending area.
Experienced auditors presumably have many other tricks up their sleeve when it comes to looking for irregularities in financial data, such as using Benford’s Law to reveal manipulation of accounting data. Particular transaction types might also attract interest, such as spend associated with “stock” or “vending” machines.
If you have any hints or tricks on how to go about looking for patterns or stories within spending data, please add them to the comments below…
![]()