OpenRefine/LODRefine – A Power Tool for Cleaning Data
In Even the Simplest Data Needs Cleaning Sometimes… A (Slightly Broken?!) Example Using Google Spreadsheets, we saw how Google Spreadsheets could be used as a tool for cleaning a simple dataset, a table of literacy rates around the world grabbed from a Wikipedia page. WHilst spreadsheets can be used to tidy a dataset, they’re not necessarily the best tool for it. In this post, we’ll see how a more powerful tool – OpenRefine – can help us clean a data set in a more controlled way.
OpenRefine – formerly known as Google Refine – is a power tool for cleaning data. As an opensource project, the code can be reused in other projects. In this example, I’ll be using LODRefine, a version of OpenRefine that has several optional OpenRefine extensions for working with linked data built in to the application (though we won’t be using any of those features in this example; OpenRefine will work just as well).
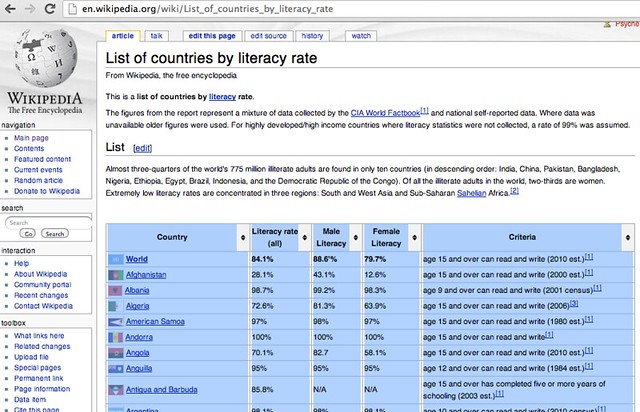
The data set we’ll be using is the same as the dataset used in the aforementioned post, a data table copied from a Wikipedia page on literacy rates.
If we launch OpenRefine/LODRefine (which I’ll refer to as just “Refine” from now on), we can paste the data copied from the Wikipedia page in to an import form directly:
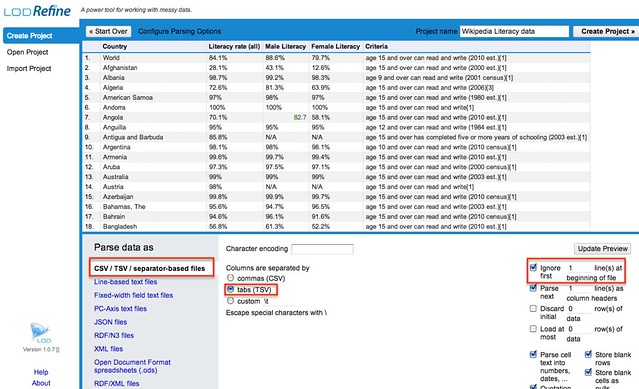
If we now import the data, a wealth of configuration options are presented to us. In this case, by inspection of the data, we need to import the data as tab separated data, and also ignore the first line of data so that the correct column headings are used:
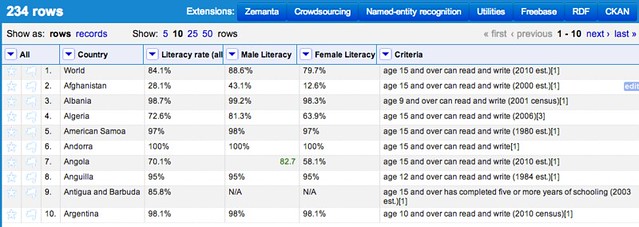
If we now create the project, the data is imported as a table:
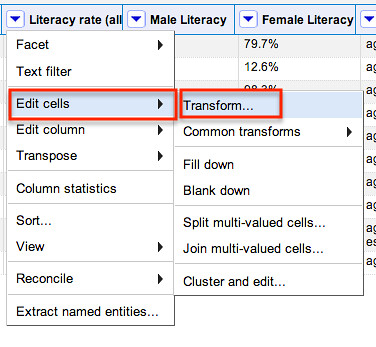
As we did in the earlier post, lets tidy the data by removing percentage signs from the numerical columns. To do this, we select the Transform tool from the drop down menu in the column we want to tidy:
The operation we’re going to do is to replace the percentage sign with nothing (that is, and empty string). We use a simple text command to achieve this (value refers to the value of a cell in the selected column; the command is applied to each row in turn).
Here’s the result when we apply the transformation:
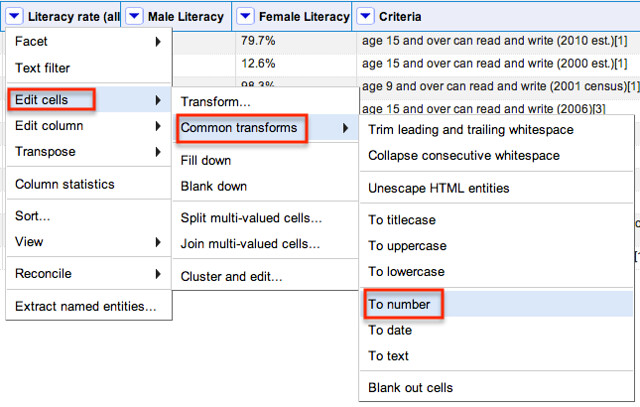
We can improve the quality of this data a little more by telling Refine that the entries in the column are numbers, rather than strings of alphanumeric characters:
Colour coding shows us that Refine now recognises the numbers as numbers:
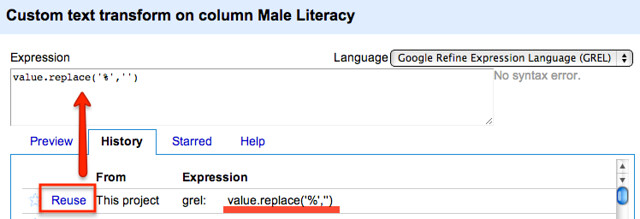
We can now start to apply a similar cleaning step to the other columns, reusing the transform we have just created:
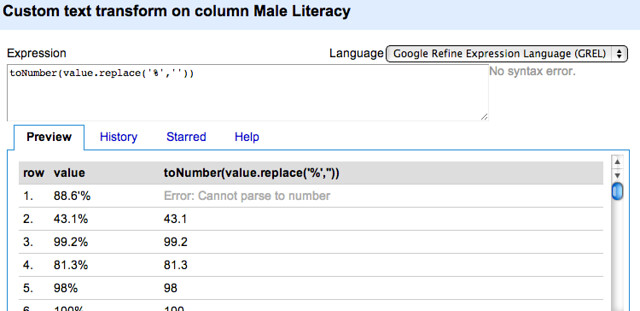
We can also build in the transformation to a number as an additional command, rather than having to do this step via the menu:
You will notice that there appears to be at least one cell that has additional mess in the cell. Go with it anyway. Where there is an error in a step, the original cell value (the one with the % sign) will be returned. We don’t know if other cells might also have returned an error, so after applying the transform we can filter the column to show only those rows where the column value contains a % sign:
It seems as if there was just one rogue cell. Let’s fix it directly – edit the cell:
Delete the rogue characters:
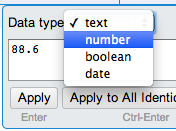
And set as a number type:
Let’s now do a bit of tidying around the Criteria column. To do this, we will keep the original column and generate a new column based on it:
In this case, I am going to use a regular expression (as we encountered in the earlier post), to edit a cell’s contents by deleting a particular pattern set of characters. Note that in the replace command we use slashes ( / .. / ), rather than quotes, to identify the pattern we want to replace:
What this expression does is look for the pattern can read and write followed by any number of characters, and if it finds that pattern it replaces it with an empty string (i.e. with nothing; it deletes the matched pattern).
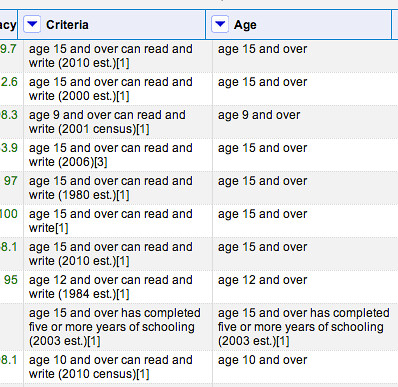
Okay – so this has mostly worked… But there are some rows where there was no pattern match and the original value has been copied over. One way round this would be to filter the original Criteria column to show only the rows that do match the pattern, and then apply the transformation:
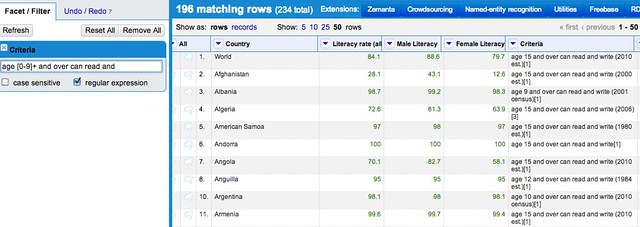
If we select the Filter option from the menu at the top of the Criteria column, we can then create a filter to just pull out the pattern matching rows:
If we now generate the new column on this filtered subset, then remove the filter, we see we have only processed the matched rows:
We can process the Criteria column in other ways too. For example, we might want to create a new column that contains the date around which the data was collected:
Or we might want to create a column that contains just the age, as a number, derived from our newly created Age2 column. (Can you see how to do that? You need to clean the column to just leave the number, then cast it to a number type.)
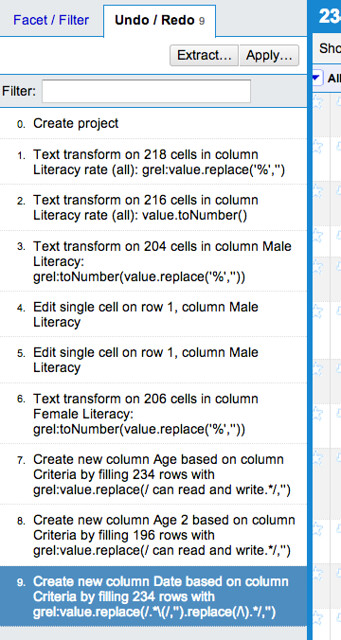
As well as providing these powerful data cleaning options (as well as many more!), Refine also keeps tracks of the steps you have followed:
If you make a mistake as you work through the dataset, you can always step back. When you save a Refine project, the original data and the history of changes will be available to you.
Of course, you also want to be able to get you cleaned data set out – the Export menu is the place to do that.
It gives you a wealth of options for exporting the data, including save to file (in a variety of formats) and upload to Google Spreadsheets.
OpenRefine (and extended clones such as LODRefine) offers a powerful tool for cleaning messy datasets. Whilst it may appear complex to use at first, it offers far more control than more general purpose tools, such as spreadsheets or text editors.













Leave a Reply