Data Roundup, 3 December
Marco Menchinella - December 3, 2013 in Data Roundup
A course on online mapping, new visualization software, corruption perceptions data, bushfires in Australia through interactive maps, climate change effects infographics, the top 5 tweets of November in data visualization, a gift list for data lovers.
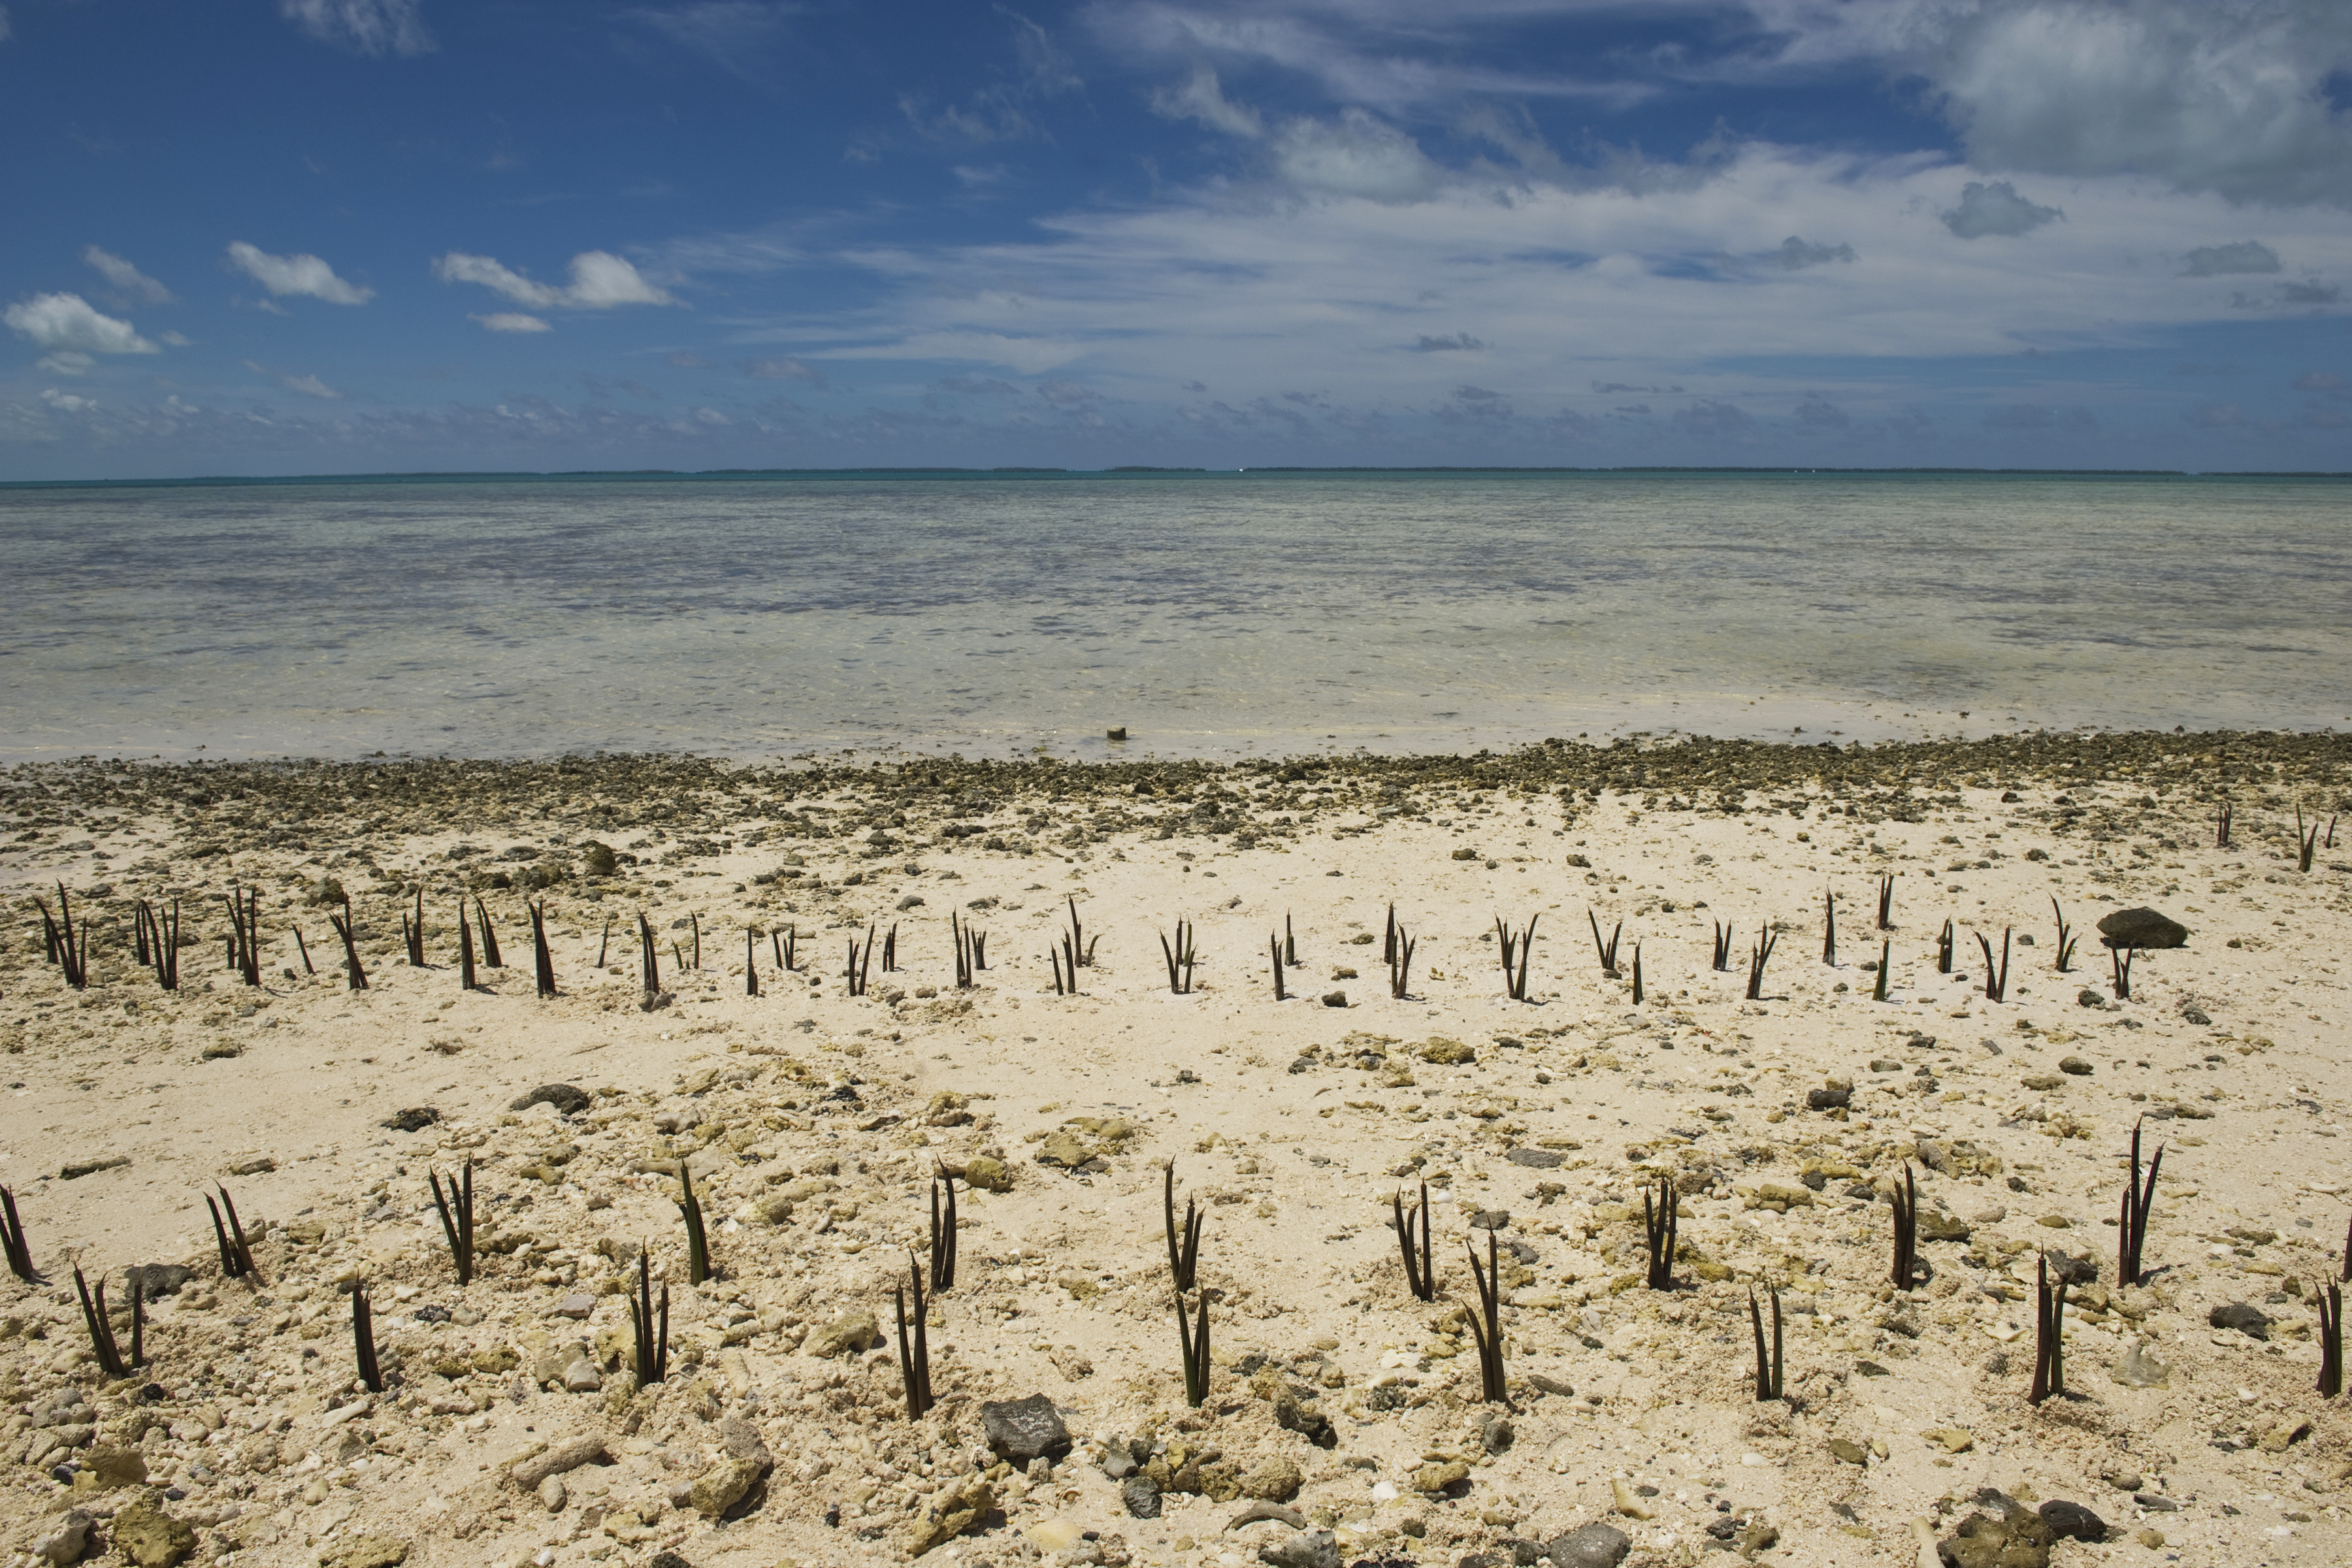
United Nations Photo – Climate Change Effects in Island Nation of Kiribati
Tools, Events, Courses
If you are a wannabe mapper and you need to acquire skills to manage your digital exploration tools you might be interested in registering at the “Online mapping for beginner” course of CartoDB starting on December the 3rd. Hurry up: only few places left!
Daniel Smilkov, Deepak Jagdish and César Hidalgo are three MIT students that developed a visualization tool called Immersion. Immersion helps you visualizing your network of e-mail contacts using only “From”, “To”, “Cc” without taking into account any kind of content.
JavaScript is one of the most common programming language frequently used to create beautiful visualizations. Follow this tutorial from dry.ly if you want to learn it bypassing D3.js. Practice makes perfect!
Data Stories
Yesterday, Transparency International launched it’s annual Corruption Perceptions Index (CPI) ranking countries according to perceived levels of corruption. Have a look at the results and see how your country ranks.
Everyone knows what a bar chart is but have you ever heard about trilinear plots? This post from Alberto Cairo introduces a short consideration on new forms of data representations and on when to break conventions in information design.
The goal of the Digital Methods Initiative of the Amsterdam University is to map and analyze causes, effects and possible future scenarios deriving from climate change. As part of this project, the students from Density Design Research Lab wrote a wonderful post outlining their visual design take on climate change.
Gender inequality is one of those big issues which varies enormously from country to country. If you are wondering what countries have the worst gender gap a look at the map published on the Slate Magazine by Jamie Zimmerman, Nicole Tosh, and Nick McClellan.
There are a lot of visualizations you can make from data coming from social networks, especially from those coming from the biggest one: Facebook. Take a minute to see those posted in this curious article from Armin Grossenbacher: “Visualising (not so) Big Data”.
In Australia bushfires occur frequently. Look at the amazing interactive story that The Guardian published on their history, showing maps with data on temperatures, hectares of land burnt and number of properties damaged.
Not everyone knows that we just passed the World Aids Day on the first of December. Tariq Khokhar reminds us the global situation of the disease in this article from the World Bank Data Blog.
Data Sources
Datavisualization.fr extracted the list of the 5 most influential tweets of November containing the hashtag #dataviz from a database of about 10.100 posts. Read it here and see who did best.
Christimas is getting closer. If you need some good suggestions on what to buy to your friends and parents take a moment to read the FlowingData Gift Guide and you’ll find some interesting data-gifts for your data-lovers.
![]()