This blog post is based on the School of Data skillshare I hosted on mobile data collection. Thanks to everyone who took part in it!
Of recent, mobile has become an increasingly popular method of data collection. This is achieved through having an application or electronic form on a mobile device such as a smartphone or a tablet. These devices offer innovative ways to gather data regardless of time and location of the respondent.
The benefits of mobile data collection are obvious, such as quicker response times and the possibility to reach previously hard-to-reach target groups. In this blog post I share some of the tools that I have been using and developing applications on top of for the past five years.
- Open Data Kit
Open Data Kit (ODK) is a free and open-source set of tools which help researchers author, field, and manage mobile data collection solutions. ODK provides an out-of-the-box solution for users to:
- Build a data collection form or survey ;
- Collect the data on a mobile device and send it to a server; and
- Aggregate the collected data on a server and extract it in useful formats.
ODK allows data collection using mobile devices and data submission to an online server, even without an Internet connection or mobile carrier service at the time of data collection.
ODK, which uses the Android platform, supports a wide variety of questions in the electronic forms such as text, number, location, audio, video, image and barcodes.
- Commcare
Commcare is an open-source mobile platform designed for data collection, client management, decision support, and behavior change communication. Commcare consists of two main technology components: Commcare Mobile and CommCareHQ.
The mobile application is used by client-facing community health workers/enumerator in visits as a data collection and educational tool and includes optional audio, image, and audio, GPS locations and video prompts. Users access the application-building platform through the website CommCareHQ which is operated on a cloud-based server.
Commcare supports J2ME feature phones, Android phones, and Android tablets and can capture photos and GPS readings, Commcare supports multi-languages and non-roman character scripts as well as the integration of multimedia (image, audio, and video).
CommCare mobile versions allow applications to run offline and collected data can be transmitted to CommCareHQ when wireless (GPRS) or Internet (WI-FI) connectivity becomes available.
- GEOODK
GeoODK provides a way to collect and store geo-referenced information, along with a suite of tools to visualize, analyze and manipulate ground data for specific needs. It enables an understanding of the data for decision-making, research, business, disaster management, agriculture and more.
It is based on the Open Data Kit (ODK), but has been extended with offline/online mapping functionalities, the ability to have custom map layer, as well as new spatial widgets, for collecting point, polygon and GPS tracing functionality.
This one blog post cannot cover each and every tool for mobile data collection, but some other tools that can be used to accomplish mobile data collection each of which having their own unique features includes OpenXData and Episurveyor.
Why Use Mobile Technology in Collecting Data
There are several advantages as to why mobile technology should be used in collecting data some of which include,
- harder skipping questions,
- immediate (real time) access to the data from the server, which also makes data aggregation and analysis to become very rapid,
- Minimizes workforce and hence reduces cost of data collection by cutting out data entry personnel.
- Data Security is enhanced through data encryption
- Collect unlimited data types such as audio, video, barcodes, GPS locations
- Increase productivity by skipping data entry middle man
· Save cost related to printing, storage and management of documents associated with paper based data collection.
]]>Import.io is a very powerful and easy-to-use tool for data extraction that has the aim of getting data from any website in a structured way. It is meant for non-programmers that need data (and for programmers who don’t want to overcomplicate their lives).
I almost forgot!! Apart from everything, it is also a free tool (o_O)
The purpose of this post is to teach you how to scrape a website and make a dataset and/or API in under 60 seconds. Are you ready?
It’s very simple. You just have to go to http://magic.import.io; post the URL of the site you want to scrape, and push the “GET DATA” button. Yes! It is that simple! No plugins, downloads, previous knowledge or registration are necessary. You can do this from any browser; it even works on tablets and smartphones.
For example: if we want to have a table with the information on all items related to Chewbacca on MercadoLibre (a Latin American version of eBay), we just need to go to that site and make a search – then copy and paste the link (http://listado.mercadolibre.com.mx/chewbacca) on Import.io, and push the “GET DATA” button.
You’ll notice that now you have all the information on a table, and all you need to do is remove the columns you don’t need. To do this, just place the mouse pointer on top of the column you want to delete, and an “X” will appear.
You can also rename the titles to make it easier to read; just click once on the column title.
Finally, it’s enough for you to click on “download” to get it in a csv file.
Now: you’ll notice two options – “Download the current page” and “Download # pages”. This last option exists in case you need to scrape data that is spread among different results pages of the same site.
In our example, we have 373 pages with 48 articles each. So this option will be very useful for us.

Good news for those of us who are a bit more technically-oriented! There is a button that says “GET API” and this one is good to, well, generate an API that will update the data on each request. For this you need to create an account (which is also free of cost).
As you saw, we can scrape any website in under 60 seconds, even if it includes tons of results pages. This truly is magic, no?
For more complex things that require logins, entering subwebs, automatized searches, et cetera, there is downloadable import.io software… But I’ll explain that in a different post.
At Escuela de Datos we collect stories on the use and appropriation of data-related projects in Latin America and Spain. Today, we share Boris Cuapio Morales’ story – he is the developer behind INEGI Fácil, a tool that allows the easy search of data offered in the not-very-user-friendly web service of Mexico’s National Statistics Institute.
We thank Boris for his time and help for this interview, which was carried out at Data Meetup Puebla. This post was originally published in Spanish by Mariel García, community manager at Escuela de Datos.

(español para seguir a continuación)
“When I was in university, I was always struck by the fact that media like The New York Times always linked to the websites of US-based information systems. I always asked myself: why is it that we don’t have such systems in Mexico, too?”
Boris Cuapio is an illustrator-turned-into-programmer that lives in Puebla, Mexico. In late 2012, he intended to use data from the National Statistics System (INEGI), and he found their web service. But he wasn’t qualified enough to use it. End of the story.
That is, until late 2013. Boris had spent some time working for Canadian clients that requested products that incorporated the use of APIs of social networks like Twitter or Flickr, which forced him to learn what he needed in order to use the web service. His workmates encouraged him to start coding on his free time in order not to lose practice, and so he thought of a new project: to try and display INEGI data in an easier, more accessible way.
That is how INEGI Fácil (Easy INEGI) was born. It is a website that queries the web service of inegi.gob.mx to show the results in tables and graphics.
Is there value in the fact that a citizen, rather than the government, was behind this project? Boris thinks the speed of institutional processes would not allow the system to undertake the technological adoptions that are necessary in services of this sort. For example: while INEGI provides data in XML (a heavy format that has been gradually abandoned in other services), INEGI Fácil provides data in JSON, and with additional markers. INEGI has a tutorial that is rather difficult to grasp, whereas INEGI Fácil has a PHP library that makes the task simpler. Thanks to Hugo, the mastermind behind the design and interaction of the site.
In reality, the government and Hugo are not competing. INEGI Fácil launched around July 2013, and in January 2014 Boris was contacted by someone at INEGI. In few words, they were surprised that someone was actually using the web service. When this service increases from its two current data sources to the hundred they expect to have, Boris will be a beta tester.
This project has allowed him to learn a lot about JS, XML, PHP, databases, dataviz – how to make graphics, how to export data. And he likes this type of work; he wants it to stop being a hobby, and rather become his main project. He wants to sell this product to universities, which are the institutions that use INEGI data the most.
But, meanwhile, he hopes all the indexes will be searchable by the end of this month, and that INEGI Fácil will soon be accessible from mobiles. In a year, if he can find financing, he would hope for INEGI Fácil to become a web service paralell to the one of INEGI itself; in other words, that it is used by media outlets through site embeds. His dream: he wants his own university to start doing information design, graphics, instructional catalogues, educational texts and other materials based on the data they can extract through INEGI Fácil.
Tip from Boris (which, according to him, he has given to everybody even if he doesn’t know anyone other than him that has followed it): “Gather your money and buy SafariBooks when you know what it is you want to learn. I have learned most things through them!”
In Mexico, platforms based on open data are being developed. Do you know others in Latin America? We would love to share their stories at Escuela de Datos.
En Escuela recopilamos historias de uso y apropiación de proyectos dateros en Latinoamérica y España. Hoy les compartimos la de Boris Cuapio Morales, creador de INEGI Fácil – una herramienta que permite la búsqueda de datos del web service del Instituto Nacional de Estadística y Geografía en México.
Agradecemos a Boris la disposición para esta entrevista, que fue llevada a cabo en Data Meetup Puebla. Este post fue publicado originalmente por Mariel García, community manager de Escuela de Datos.
“En la universidad, me llamaba la atención que las notas en medios como The New York Times siempre se enlazaba a páginas web de sistemas de información de EEUU. Entonces yo me preguntaba: ¿Por qué no hay en México sistemas así?”
Boris Cuapio es un ilustrador-convertido-en-programador que vive en Puebla, México. A finales de 2012, él tenía la intención de usar información del INEGI, y encontró el servicio web… pero no tenía la capacidad para usarlo. Fin de la historia.
…Hasta finales de 2013. Boris estuvo trabajando para clientes en Canadá, que pedían productos que incorporaban el uso de APIs de redes sociales como Twitter o Flickr, lo cual le capacitó para usar el servicio web. Sus compañeros de trabajo le recomendaron comenzar proyectos de programación personales para no perder práctica, él pensó en uno: tratar de mostrar los datos del INEGI de una manera más fácil y más accesible.
Así nació INEGI Fácil, un portal que hace consultas al servicio web de inegi.gob.mx, y muestra los resultados en tablas y gráficas.
¿Pero por qué hay valor en que esto lo haga un ciudadano, y no el gobierno en sí? Boris piensa que la velocidad de los procesos institucionales no permitiría las adopciones tecnológicas que son necesarias en servicios de este tipo. Por ejemplo: mientras INEGI provee datos en XML (formato pesado que se ha ido abandonando en otros servicios), INEGI Fácil ya los da en JSON, y con marcadores adicionales. INEGI tiene un tutorial un tanto difícil de acceder, mientras que INEGI Fácil tiene una librería PHP que simplifica el trabajo. En términos de experiencia de usuario, no hay comparación (gracias a Hugo, la mente maestra detrás de los temas de diseño e interacción del sitio).
En realidad, el gobierno y él no son competencia. INEGI Fácil inició cerca de julio de 2013, y en enero de 2013 Boris fue contactado una persona en el INEGI. En pocas palabras, les sorprendió que alguien de hecho usara los servicios web! Cuando el sitio pase de sus dos fuentes actuales de información a las cien planeadas, él será un beta tester.
El proyecto le ha permitido aprender mucho sobre JS, XML, PHP, bases de datos, dataviz – cómo hacer gráficas, cómo exportar datos. Y le gusta ese trabajo; quiere que ya no sea un hobby, sino su proyecto principal. Quiere vender el producto a universidades, porque es donde más se utiliza los datos del INEGI.
Pero, por lo pronto, espera que en este mes los índices ya sean buscables y se pueda acceder a INEGI Fácil desde celulares. En un año, si consigue dinero, esperaría que se convierta un servicio web paralelo al INEGI; es decir, que lo utilicen medios de comunicación a través de embeds. Su ideal: le gustaría que en su universidad hagan diseño de información, gráficas, catálogos instructivos, textos educativos, y que aprovechen INEGI Fácil.
Tip datero de Boris (que, según él, le da a todo mundo, y nadie ha seguido) – “Junta tu dinero y contrata SafariBooks. Con eso puedes aprender lo que sea”.
En México se desarrolla plataformas basadas en datos abiertos. ¿Conoces otras en Latinoamérica? Nos encantará difundir sus historias en Escuela.
But how do we even start to work with such data? One way is to try to start making sense of it by visualising the networks that reveal themselves as we start to learn that company A has subsidiaries B and C, and major shareholdings in companies D, E and F, and that those companies in turn have ownership relationships with other companies or each other.
But how can we go about visualising such networks?!
This walkthrough shows one way, using company network data downloaded from OpenCorporates using OpenRefine, and then visualised using Gephi, a cross-platform desktop application for visualising large network data sets: Mapping Corporate Networks – Intro (slide deck version).
The walkthrough also serves as a quick intro to the following data wrangling activities, and can be used as a quick tutorial to cover each of them.
- how to hack a web address/URL to get data-as-data from a web page (doesn’t work everywhere, unfortunately;
- how to get company ownerships network data out of OpenCorporates;
- how to download JSON data and get it into a nice spreadsheet/tabular data format using OpenRefine;
- how to filter a tabular data file to save just the columns you want;
- a quick intro to using the Gephi netwrok visualisation tool;
- how to visualise a simple date file containing a list of how companies connect using Gephi;
Download it here: Mapping Corporate Networks – Intro.
So if you’ve ever wondered how to download JSON data so you can load it into a spreadsheet, or how to visualise how two lists of things relate to each other using Gephi, give it a go… We’d love to hear any comments you have on the walkthrough too, (what you liked, what you didn’t, what’s missing, what’s superfluous, what worked well for you, what didn’t and most of all – what use you put to anything you learned from the tutorial!:-)
If you would like to learn more about working with company network data, see the School of Data blogpost Working With Company Data which links to additional resources.
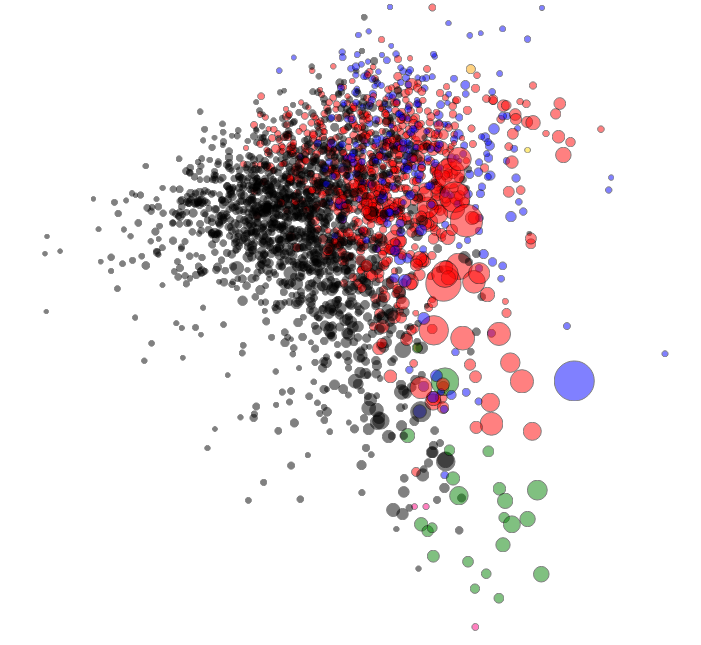
]]>After the German elections, data visualization genius Moritz Stefaner created a map of election districts, grouping them not by geography but by election patterns. This visualisation impressively showed a still-existing divide in Germany. It is a fascinating alternative way to look at elections. On his blog, he explains how he did this visualization. I decided to reconstruct it using Austrian election data (and possibly more countries coming).
Austria recently published the last election’s data as open data, so I took the published dataset and cleaned it up by removing summaries and introducing names for the different states (yes, this is a federal state). Then I looked at how to get the results mapped out nicely.
In his blog post, Moritz explains that he used Z-Scores to normalize data and then used a technique called Multidimensional Scaling (MDS) to map the distances calculated between points into 2-dimensional space. So I checked out Multidimensional Scaling, starting on Wikipedia, where I discovered that it’s linear algebra way over my head (yes, I have to finish Strang’s course on linear Algebra at some point). The Wikipedia article fortunately mentions a R command cmdscale that does multidimensional scaling for you. Lucky me! So I wrote a quick R script:
First I needed to normalize the data. Normalization becomes necessary when the raw data itself is very hard to compare. In election data, some voting stations will have a hundred voters, some a thousand; if you just take the raw vote-count, this doesn’t work well to compare, as the numbers are all over the place, so usually it’s broken down into percentages. But even then, if you want to value all parties equally (and have smaller parties influence the graph as much as larger parties), you’ll need to apply a formula to make the numbers comparable.
I decided to use Z-Scores as used by Moritz. The Z-Score is a very simple normalization score that takes two things, the mean and the standard deviation, and tells you how many standard deviations a measurement is above the average measurement. This is fantastic to use in high-throughput testing (the biomed nerd in me shines through here) or to figure out which districts voted more than usual for a specific party.
After normalization, you can perform the magic. I used dist to calculate the distances between districts (by default, this uses Euclidean distance) and then used cmdscale to do the scaling. Works perfectly!
With newly created X and Y coordinates, the only thing left is visualization—a feat I accomplished using D3 (look at the code—danger, there be dragons). I chose a simpler way of visualizing the data: bubbles the size of voters in the district, the color of the strongest party.
You can see: Austria is less divided than Germany. However, if you know the country, you’ll find curious things: Vienna and the very west of Austria, though geographically separated, vote very similarly. So while I moved across the country to study when I was 18, I didn’t move all that much politically. Maybe this is why Vienna felt so comfortable back then—but this is another story to be explored another time.
]]>A couple of quick things that may be of use in the current data expedition around the Bangladeshi garment industry…
Matching company names
One possible route for the expedition to take is to look to see whether a company referred to in one list (for example, a particular suppliers list) is also mentioned in another list (for example, the accord on fire safety, or a another supplier’s factory list or factory blacklist). It is quite possible that names won’t match exactly… Some clues for how to address this are described in the School of Data blog post Finding Matching Items on Separate Lists – Bangladeshi Garment Factories.
Other things you can try:
- use a tool such as OpenRefine to fix the capitalisation, for example by converting names to titlecase (Edit Cells->Common Transforms->To titlecase);
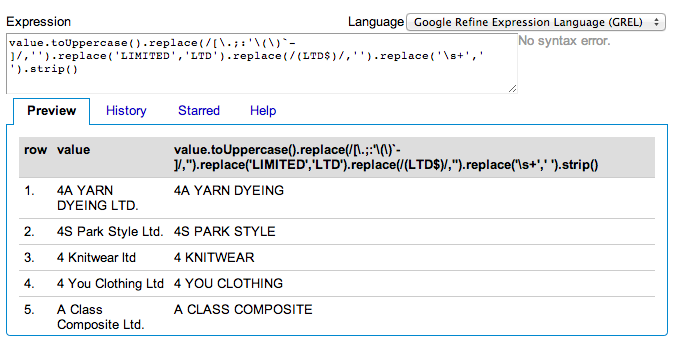
- a lossy approach (and so not ideal), though one that can help with exact string matching, is to get to the “core” of the company name, for example by stripping out mentions to words like “Limited”, or variants thereof:
Here’s the command used in OpenRefine in that example:
value.toUppercase().replace(/[.;:’()`-]/,”).replace(‘LIMITED’,’LTD’).replace(/(LTD$)/,”).replace(‘\s+’,’ ‘).strip()
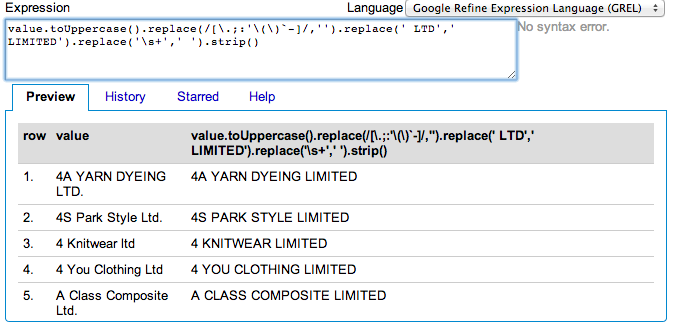
A better approach might be to “normalise” mentions to “Ltd”, etc, using something like this:
value.toUppercase().replace(/[.;:’()`-]/,”).replace(‘ LTD’,’ LIMITED’).replace(‘\s+’,’ ‘).strip()
Corporate Identifiers
As described in the post On the Need for Corporate Identifiers , it’s often more convenient if we can represent companies using unique and unambiguous corporate identifiers.
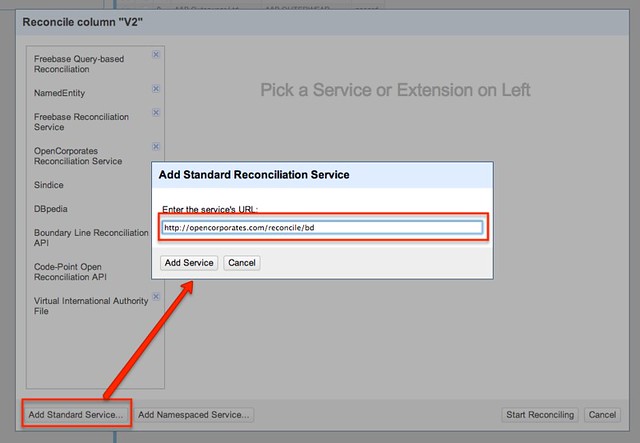
OpenCorporates have recently uploaded details of Bangladeshi registered companies to their databases; using the OpenCorporates reconciliation API, mapping “messy” names to company identifiers can be handled by OpenCorporates automatically, with a confidence score describing the likelihood of a match being a “true” match.
The OpenCorporates reconciliation API can be used to match company names to just Bangladeshi registered companies using the reconciliation endpoint http://opencorporates.com/reconcile/bd
For convenience, I quickly ran the names of the company on the fire safety accord through the reconciliation process (results here). Not all the company names are matched, but a good proportion are. To match the rest, filter out the unmatched items, run the reconciliation search on what’s left and see if you can improve the matches.) Note that inspecting that data, I see that it needs cleaning a little! Also, the scraper used to get the data from the accord PDF is slightly broken.
Reconciliation is most easily achieved using OpenRefine. From the header of the company name column, select Reconcile -> Start reconciling...
Accept the defaults, and click on Start Reconciling to begin the matching process.
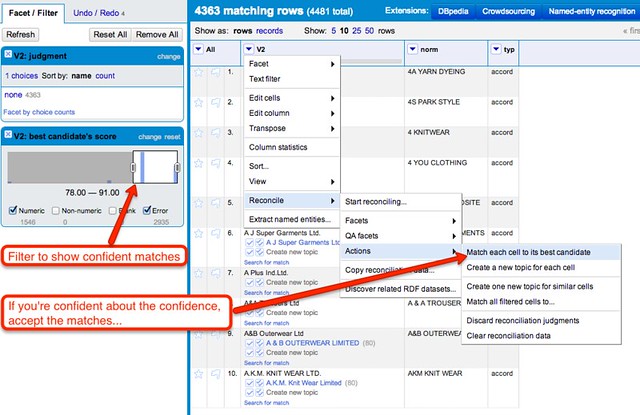
You can then set about accepting – or not – the matches… I tend to filter to just display the confident matches and accept them:
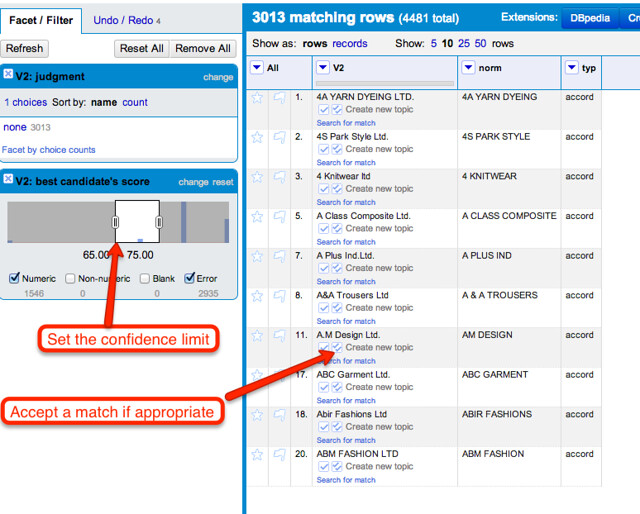
Then I look at the middling matches and accept those by hand:
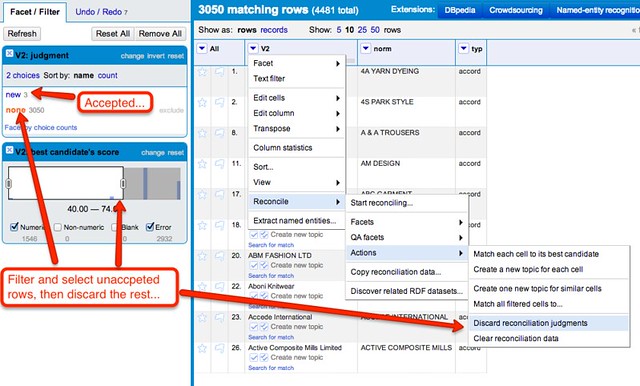
Then I’m often tempted to filter down to the results I’m not confident about and discard the reconciliation judgements:
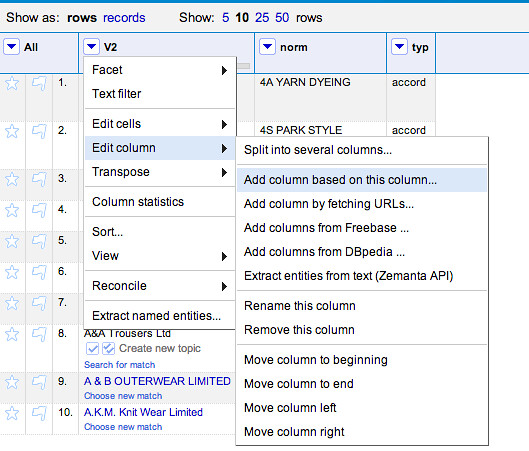
You can generate new columns based on the data pulled down from the reconciliation API:
For example:
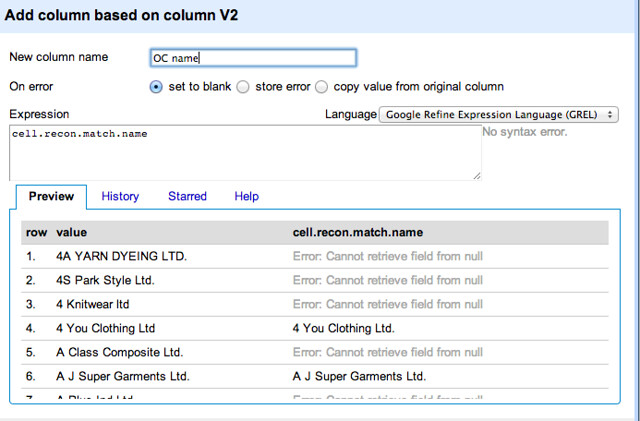
- to get the reconciled company name, create a new column based on the reconciled column with the pattern cell.recon.match.name.
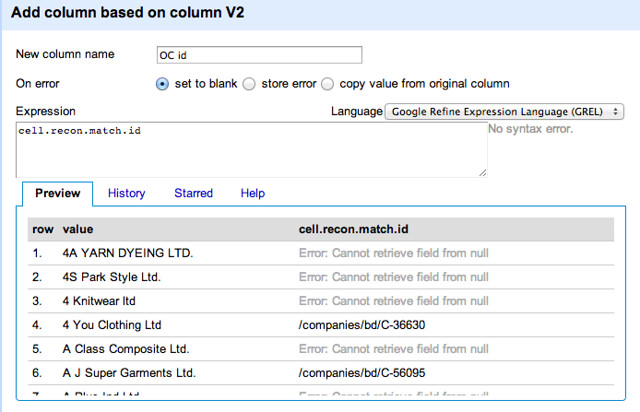
- to get the reconciled company identifier, create a new column based on the reconciled column with the pattern cell.recon.match.id.
If you reconcile names appearing in different lists, your data will be enriched with unambiguous names and identifiers that you can use to support company matching across differnt data files.
Addresses
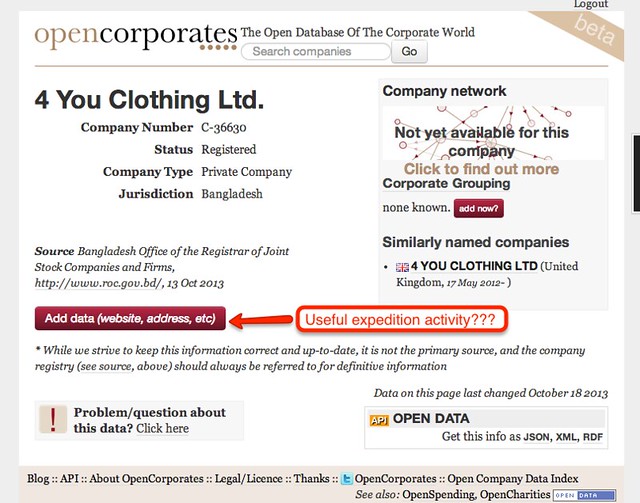
There may be some work to be done around the addresses associated with each company. For example, the Bangladeshi company descriptions on OpenCorporates seem to be lacking in address information. There may be some merit in treating OpenCorporates as the bast place to store this information, and then retrieve it through the various OpenCorporates APIs as required. At the current time, volunteer effort in terms of adding address information to OpenCorporates may be one way forward?
A major use for the addresses is to support mapping activities. Some geocoders may give spurious locations for some addresses – try to force the issue by adding , Bangladesh on to the end of every address you geocode.
It may be possible to augment addresses for geocoding using additional geographical region information. There is a list of Bangladesh postcodes by area published at http://www.bangladeshpost.gov.bd/postcode.asp which I have scraped and popped into a data file here:
https://github.com/psychemedia/ScoDa-GarmentsDataExpedition/tree/master/geocoding
It may be possible/appropriate to annotate addresses with additional information from this file, for example by matching on district and/or division and adding in more information to the geocoded address, where possible. (Phone city codes may also help identify additional address information – is there a mapping of these somewhere? Or could we construct one?)
If you do get latitude/longitude coordinates for an address, try to also associate the co-ordinates with an OpenCorporates company identifier to support unambiguous matching of co-ordinates/locations to names (although there may be multiple names/identifiers associated with a particular location).
Other hints and tips
If you have any other tricks that may be useful to support the current data expedition, please feel free to add a link to, or description of, them as a comment to this post.
Or if you discover or develop a useful technique during the data expedition that you think would have helped had you come across it before you started the expedition, again, please link to or describe it in the comments below.
Data resources: data resources to support the investigation are available here:
– http://datahub.io/dataset/bangladesh-garment-industry-dataset
– Global Garment Supply Chain Data

D3 is a fantastic framework for visualization – besides its beautiful outputs, the framework itself is elegantly designed. However, its elegance and combination of several technologies (javascript + svg + DOM manipulations) make it very hard to learn D3. Luckily, there is a huge range of D3 examples out there. Cargo-Cults to the rescue…
Cargo Cults were the way Melanesians responded when they suddenly were confronted with military forces in the second world war: strangers arrived wearing colorful clothes, marched up and down strips of land and suddenly: parachutes with cargo-crates were dropped. After the strangers left, the islanders were convinced that, if they just behaved like the strangers, cargo would come to them. As the islanders, we don’t have to understand the intricate details of D3 – we just have to perform the right rituals to be able to do the same visualizations…
Let’s for example try to re-create a Reingold-Tilford tree of the Goldman Sachs network.
Things I’ll work with:
The Reingold-Tilford tree example
the Goldman Sachs Network over at Opencorporates (you can get the data in their json format)
The first thing I always look at is: how is the data formatted for the example: Most of the examples provide data with it that help you to understand how the data is layed-out for this specific example. This also means: if we bring our data into the same shape, we’ll be able to use our data in the example. So let’s look at the “flare.json” format, that is used in the example. It is a very simple json format where each entry has two attributes: a name and an array of children – this forms the tree for our tree layout. The data we have from Open Corporates looks different, here we always have parent and child – but let’s bring this into the same form.
First, I’ll get the javascript bits I’ll need: d3 and underscore (I like underscore for its functions that make working with data a lot nicer), then I’ll create an HTML page similar to the example. I’ll check in the code where the “flare.json” file is loaded and put my own json in it (the one from opencorporates linked above) (commit note- that changes later on, since opencorporates does not do CORS…).
I then convert the data using a javascript function (in our case a recursive one, that crawls down the tree)
 var getChildren = function(r,parent) {
    c=_.filter(r,function(x) {return x.parent_name == parent})
    if (c.length) {
      return ({"name":parent,
        children: _.map(c,function(x) {return (getChildren(r,x.child_name))})})
      }
    else {
      return ({"name":parent })
    }
  }
  root=getChildren(root,"GOLDMAN SACHS HOLDINGS (U.K.)")
Finally, I adjust the layout a bit to make space for the labels etc
]]>First we will scrape and collect the data. I will use Python as a programming language – but you could do it in any other programming language. (If you don’t know how to program, don’t worry.) I’ll use Gephi to analyze and visualize the network in the next step. Now let’s see what we can find…
The IATI’s data is collected on their data platform, the IATI registry. This site is mainly links to the data in XML format. The IATI standard is an XML-based standard that took policy and data wonks years to develop – but it’s an accepted standard in the field, and many organizations use it. Python, luckily, has good tools to deal with XML. the IATI registry also has an API, with examples on how to use it. It returns JSON, which is great, since that’s even simpler to deal with than XML. Let’s go!
From the examples, we learn that we can use the following URL to query for activities in a specific country (Kenya in our example):
http://www.iatiregistry.org/api/search/dataset?filetype=activity&country=KE&all_fields=1&limit=200
If you take a close look at the resulting JSON, you will notice it’s an array ([]) of objects ({}) and that each object has a download_url attribute. This is the link to the XML report.
First we’ll need to get all the URLs:
>>> import urllib2, json #import the libraries we need

>>> url="http://www.iatiregistry.org/api/search/" + "datasetfiletype=activity&country=KE&all_fields=1&limit=200"
>>> u=urllib2.urlopen(url)
>>> j=json.load(u)
>>> j['results'][0]
That gives us:
{u'author_email': u'[email protected]',
 u'ckan_url': u'http://iatiregistry.org/dataset/afdb-kenya',
 u'download_url': u'http://www.afdb.org/fileadmin/uploads/afdb/Documents/Generic-Documents/IATIKenyaData.xml',
 u'entity_type': u'package',
 u'extras': {u'activity_count': u'5',
  u'activity_period-from': u'2010-01-01',
  u'activity_period-to': u'2011-12-31',
  u'archive_file': u'no',
  u'country': u'KE',
  u'data_updated': u'2013-06-26 09:44',
  u'filetype': u'activity',
  u'language': u'en',
  u'publisher_country': u'298',
  u'publisher_iati_id': u'46002',
  u'publisher_organization_type': u'40',
  u'publishertype': u'primary_source',
  u'secondary_publisher': u'',
  u'verified': u'no'},
 u'groups': [u'afdb'],
 u'id': u'b60a6485-de7e-4b76-88de-4787175373b8',
 u'index_id': u'3293116c0629fd243bb2f6d313d4cc7d',
 u'indexed_ts': u'2013-07-02T00:49:52.908Z',
 u'license': u'OKD Compliant::Other (Attribution)',
 u'license_id': u'other-at',
 u'metadata_created': u'2013-06-28T13:15:45.913Z',
 u'metadata_modified': u'2013-07-02T00:49:52.481Z',
 u'name': u'afdb-kenya',
 u'notes': u'',
 u'res_description': [u''],
 u'res_format': [u'IATI-XML'],
 u'res_url': [u'http://www.afdb.org/fileadmin/uploads/afdb/Documents/Generic-Documents/IATIKenyaData.xml'],
 u'revision_id': u'91f47131-529c-4367-b7cf-21c8b81c2945',
 u'site_id': u'iatiregistry.org',
 u'state': u'active',
 u'title': u'Kenya'}
So j['results'] is our array of result objects, and we want to get the
download_url properties from its members. I’ll do this with a list comprehension.
>>> urls=[i['download_url'] for i in j['results']]
>>> urls[0:3]
[u'http://www.afdb.org/fileadmin/uploads/afdb/Documents/Generic-Documents/IATIKenyaData.xml', u'http://www.ausaid.gov.au/data/Documents/AusAID_IATI_Activities_KE.xml', u'http://www.cafod.org.uk/extra/data/iati/IATIFile_Kenya.xml']
Fantastic. Now we have a list of URLs of XML reports. Some people might say, “Now
you’ve got two problems” – but I think we’re one step further.
We can now go and explore the reports. Let’s start to develop what we want to do
with the first report. To do this we’ll need lxml.etree, the XML library. Let’s use it to parse the XML from the first URL we grabbed.
>>> import lxml.etree
>>> u=urllib2.urlopen(urls[0]) #open the first url
>>> r=lxml.etree.fromstring(u.read()) #parse the XML
>>> r
<Element iati-activities at 0x2964730>
Perfect: we have now parsed the data from the first URL.
To understand what we’ve done, why don’t you open the XML report
in your browser and look at it? Notice that every activity has its own
tag iati-activity and below that a recipient-country tag which tells us which country gets the money.
We’ll want to make sure that we only
include activities in Kenya – some reports contain activities in multiple
countries – and therefore we have to select for this. We’ll do this using the
XPath query language.
>>> rc=r.xpath('//recipient-country[@code="KE"]')
>>> activities=[i.getparent() for i in rc]
>>> activities[0]
<Element iati-activity at 0x2972500>
Now we have an array of activities – a good place to start. If you look closely
at activities, there are several participating-org entries with different
roles. The roles we’re interested in are “Funding” and “Implementing”: who
gives money and who receives money. We don’t care right now about amounts.
>>> funders=activities[0].xpath('./participating-org[@role="Funding"]')
>>> implementers=activities[0].xpath('./participating-org[@role="Implementing"]')
>>> print funders[0].text
>>> print implementers[0].text
Special Relief Funds
WORLD FOOD PROGRAM - WFP - KENYA OFFICE
Ok, now let’s group them together, funders first, implementers later. We’ll do
this with a list comprehension again.
>>> e=[[(j.text,i.text) for i in implementers] for j in funders]
>>> e
[[('Special Relief Funds', 'WORLD FOOD PROGRAM - WFP - KENYA OFFICE')]]
Hmm. There’s one bracket too many. I’ll remove it with a reduce…
>>> e=reduce(lambda x,y: x+y,e,[])
>>> e
[('Special Relief Funds', 'WORLD FOOD PROGRAM - WFP - KENYA OFFICE')]
Now we’re talking. Because we’ll do this for each activity in each report, we’ll
put it into a function.
>>> def extract_funders_implementers(a):
...     f=a.xpath('./participating-org[@role="Funding"]')
...     i=a.xpath('./participating-org[@role="Implementing"]')
...     e=[[(j.text,k.text) for k in i] for j in f]
...     return reduce(lambda x,y: x+y,e,[])
...
>>> extract_funders_implementers(activities[0])</code>
[('Special Relief Funds', 'WORLD FOOD PROGRAM - WFP - KENYA OFFICE')]
Now we can do this for all the activities!
>>> fis=[extract_funders_implementers(i) for i in activities]
>>> fis
[[('Special Relief Funds', 'WORLD FOOD PROGRAM - WFP - KENYA OFFICE')], [('African Development Fund', 'KENYA  NATIONAL  HIGHWAY  AUTHORITY')], [('African Development Fund', 'MINISTRY OF WATER DEVELOPMENT')], [('African Development Fund', 'MINISTRY OF WATER DEVELOPMENT')], [('African Development Fund', 'KENYA ELECTRICITY TRANSMISSION CO. LTD')]]
Yiihaaa! But we have more than one report, so we’ll need to create a
function here as well to do this for each report….
>>> def process_report(report_url):
...     try:
...         u=urllib2.urlopen(report_url)
...         r=lxml.etree.fromstring(u.read())
...     except urllib2.HTTPError:
...         return []  # return an empty array if something goes wrong
...     activities=[i.getparent() for i in </code>
...     r.xpath('//recipient-country[@code="KE"]')]</code>
...     return reduce(lambda x,y: x+y,[extract_funders_implementers(i) for i in activities],[])
...
>>> process_report(urls[0])
Works great – notice how I removed the additional brackets with using another
reduce? Now guess what? We can do this for all the reports! – ready? Go!
>>> fis=[process_report(i) for i in urls]
>>> fis=reduce(lambda x,y: x+y, fis, [])
>>> fis[0:10]
[('Special Relief Funds', 'WORLD FOOD PROGRAM - WFP - KENYA OFFICE'), ('African Development Fund', 'KENYA  NATIONAL  HIGHWAY  AUTHORITY'), ('African Development Fund', 'MINISTRY OF WATER DEVELOPMENT'), ('African Development Fund', 'MINISTRY OF WATER DEVELOPMENT'), ('African Development Fund', 'KENYA ELECTRICITY TRANSMISSION CO. LTD'), ('CAFOD', 'St. Francis Community Development Programme'), ('CAFOD', 'Catholic Diocese of Marsabit'), ('CAFOD', 'Assumption Sisters of Nairobi'), ('CAFOD', "Amani People's Theatre"), ('CAFOD', 'Resources Oriented Development Initiatives (RODI)')]
Good! Now let’s save this as a CSV:
>>> import csv
>>> f=open("kenya-funders.csv","wb")
>>> w=csv.writer(f)
>>> w.writerow(("Funder","Implementer"))
>>> for i in fis:
...     w.writerow([j.encode("utf-8") if j else "None" for j in i])
...
>>> f.close()
Now we can clean this up using Refine and examine it with Gephi in part II.
]]>While for simple single or double-page tables tabula is a viable option – if you have PDFs with tables over multiple pages you’ll soon grow old marking them.
This is where you’ll need some scripting. Thanks to scraperwikis library (pip install scraperwiki) and the included function pdftoxml – scraping PDFs has become a feasible task in python. On a recent Hacks/Hackers event we run into a candidate – that was quite tricky to scrape – I decided to protocol the process here.
import scraperwiki, urllib2
First import the scraperwiki library and urllib2 – since the file we’re using is on a webserver – then open and parse the document…
  u=urllib2.urlopen("http://images.derstandard.at/2013/08/12/VN2p_2012.pdf")
  #open the url for the PDF
  x=scraperwiki.pdftoxml(u.read()) # interpret it as xml
  print x[:1024] # let's see what's in there abbreviated...
<?xml version="1.0" encoding="UTF-8"?>
<!DOCTYPE pdf2xml SYSTEM "pdf2xml.dtd">

<pdf2xml producer="poppler" version="0.22.5">
<page number="1" position="absolute" top="0" left="0" height="1263" width="892">
    <fontspec id="0" size="8" family="Times" color="#000000"/>
    <fontspec id="1" size="7" family="Times" color="#000000"/>
<text top="42" left="64" width="787" height="12" font="0"><b>TABELLE VN2Ap/1
                                                  30/07/13  11.38.44  BLATT    1 </b></text>
<text top="58" left="64" width="718" height="12" font="0"><b>STATISTIK ALLER VORNAMEN (TEILWEISE PHONETISCH ZUSAMMENGEFASST, ALPHABETISCH SORTIERT) FÜR NEUGEBORENE KNABEN MIT </b></text>
<text top="73" left="64" width="340" height="12" font="0"><b>ÖSTERREICHISCHER STAATSBÜRGERSCHAFT 2012  - ÖSTERREICH </b></text>
<text top="89" left="64" width="6" height="12" font="0"><b> </b></text>
<text top="104" left="64" width="769" height="12" font="0"><b>VORNAMEN                  ABSOLUT
%
As you can see above, we have successfully loaded the PDF as xml (take a look at
the PDF by just opening the url given, it should give you an idea how it is
structured).
The basic structure of a pdf parsed this way will always be page tags
followed by text tags contianing the information, positioning and font
information. The positioning and font information can often help to get the
table we want – however not in this case: everything is font=”0″ and left=”64″.
We can now use xpath to query our
document…
import lxml
r=lxml.etree.fromstring(x)
r.xpath('//page[@number="1"]')
[<Element page at 0x31c32d0>]
and also get some lines out of it
r.xpath('//text[@left="64"]/b')[0:10] #array abbreviated for legibility
[<Element b at 0x31c3320>,
 <Element b at 0x31c3550>,
 <Element b at 0x31c35a0>,
 <Element b at 0x31c35f0>,
 <Element b at 0x31c3640>,
 <Element b at 0x31c3690>,
 <Element b at 0x31c36e0>,
 <Element b at 0x31c3730>,
 <Element b at 0x31c3780>,
 <Element b at 0x31c37d0>]
r.xpath('//text[@left="64"]/b')[8].text
u'Aaron *                        64       0,19       91               Aim\xe9
1       0,00      959 '
Great – this will help us. If we look at the document you’ll notice that there
are all boys names from page 1-20 and girls names from page 21-43 – let’s get
them seperately…
boys=r.xpath('//page[@number<="20"]/text[@left="64"]/b')
girls=r.xpath('//page[@number>"20" and @number<="43"]/text[@left="64"]/b')
print boys[8].text
print girls[8].text
Aaron *                        64       0,19       91               Aimé                            1
   0,00      959
Aarina                          1       0,00    1.156               Alaïa                           1
   0,00    1.156
fantastic – but you’ll also notice something – the columns are all there,
sperated by whitespaces. And also Aaron has an asterisk – we want to remove it
(the asterisk is explained in the original doc).
To split it up into columns I’ll create a small function using regexes to split
it.
import re
def split_entry(e):
return re.split("[ ]+",e.text.replace("*","")) # we're removing the asterisk here as well...
now let’s apply it to boys and girls
boys=[split_entry(i) for i in boys]
girls=[split_entry(i) for i in girls]
print boys[8]
print girls[8]
[u'Aaron', u'64', u'0,19', u'91', u'Aim\xe9', u'1', u'0,00', u'959', u'']
[u'Aarina', u'1', u'0,00', u'1.156', u'Ala\xefa', u'1', u'0,00', u'1.156', u'']
That worked!. Notice the empty string u” at the end? I’d like to filter it.
I’ll do this using the ifilter function from itertools
import itertools
boys=[[i for i in itertools.ifilter(lambda x: x!="",j)] for j in boys]
girls=[[i for i in itertools.ifilter(lambda x: x!="",j)] for j in girls]
print boys[8]
print girls[8]
[u'Aaron', u'64', u'0,19', u'91', u'Aim\xe9', u'1', u'0,00', u'959']
[u'Aarina', u'1', u'0,00', u'1.156', u'Ala\xefa', u'1', u'0,00', u'1.156']
Worked, this cleaned up our boys and girls arrays. We want to make them properly
though – there are two columns each four fields wide. I’ll do this with a little
function
def take4(x):
if (len(x)>5):
return [x[0:4],x[4:]]
else:
return [x[0:4]]
boys=[take4(i) for i in boys]
girls=[take4(i) for i in girls]
print boys[8]
print girls[8]
[[u'Aaron', u'64', u'0,19', u'91'], [u'Aim\xe9', u'1', u'0,00', u'959']]
[[u'Aarina', u'1', u'0,00', u'1.156'], [u'Ala\xefa', u'1', u'0,00', u'1.156']]
ah that worked nicely! – now let’s make sure it’s one array with both options in
it -for this i’ll use reduce
boys=reduce(lambda x,y: x+y, boys, [])
girls=reduce(lambda x,y: x+y, girls,[])
print boys[10]
print girls[10]
['Aiden', '2', '0,01', '667']
['Alaa', '1', '0,00', '1.156']
perfect – now let’s add a gender to the entries
for x in boys:
x.append("m")
for x in girls:
x.append("f")
print boys[10]
print girls[10]
['Aiden', '2', '0,01', '667', 'm']
['Alaa', '1', '0,00', '1.156', 'f']
We got that! For further processing I’ll join the arrays up
names=boys+girls
print names[10]
['Aiden', '2', '0,01', '667', 'm']
let’s take a look at the full array…
names[0:10]
[['TABELLE', 'VN2Ap/1', '30/07/13', '11.38.44', 'm'],
 ['BLATT', '1', 'm'],
 [u'STATISTIK', u'ALLER', u'VORNAMEN', u'(TEILWEISE', 'm'],
 [u'PHONETISCH',
  u'ZUSAMMENGEFASST,',
  u'ALPHABETISCH',
  u'SORTIERT)',
  u'F\xdcR',
  u'NEUGEBORENE',
  u'KNABEN',
  u'MIT',
  'm'],
 [u'\xd6STERREICHISCHER', u'STAATSB\xdcRGERSCHAFT', u'2012', u'-', 'm'],
 ['m'],
 ['VORNAMEN', 'ABSOLUT', '%', 'RANG', 'm'],
 ['VORNAMEN', 'ABSOLUT', '%', 'RANG', 'm'],
 ['m'],
 ['INSGESAMT', '34.017', '100,00', '.', 'm']]
Notice there is still quite a bit of mess in there: basically all the lines
starting with an all caps entry, “der”, “m” or “f”. Let’s remove them….
names=itertools.ifilter(lambda x: not x[0].isupper(),names) # remove allcaps entries
names=[i for i in itertools.ifilter(lambda x: not (x[0] in ["der","m","f"]),names)]
 # remove all entries that are "der","m" or "f"
names[0:10]
[['Aiden', '2', '0,01', '667', 'm'],
 ['Aiman', '3', '0,01', '532', 'm'],
 [u'Aaron', u'64', u'0,19', u'91', 'm'],
 [u'Aim\xe9', u'1', u'0,00', u'959', 'm'],
 ['Abbas', '2', '0,01', '667', 'm'],
 ['Ajan', '2', '0,01', '667', 'm'],
 ['Abdallrhman', '1', '0,00', '959', 'm'],
 ['Ajdin', '15', '0,04', '225', 'm'],
 ['Abdel', '1', '0,00', '959', 'm'],
 ['Ajnur', '1', '0,00', '959', 'm']]
Woohoo – we have a cleaned up list. Now let’s write it as csv….
import csv
f=open("names.csv","wb") #open file for writing
w=csv.writer(f) #open a csv writer
w.writerow(["Name","Count","Percent","Rank","Gender"]) #write the header
for n in names:
w.writerow([i.encode("utf-8") for i in n]) #write each row
f.close()
Done, We’ve scraped a multi-page PDF using python. All in all this was a fairly
quick way to get the data out of a PDF using the scraperwiki module.
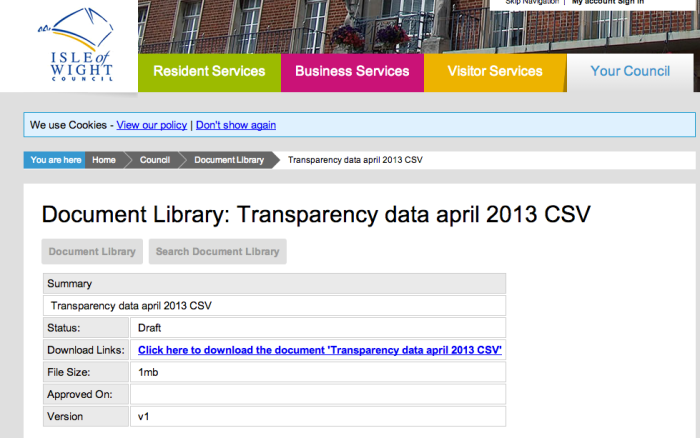
To make things a little more concrete, consider this example. Under UK transparency regulations, local councils publish spending data for amounts over £500 on a monthly basis:
To get to the actual download link for the CSV data files requires another click… (example CSV file, if you want to play along…;-)
If we want to get this data into a site such as OpenSpending.org, we need to do a little bit of tidying of the data to get it into the format that OpenSpending expects (see for example The OpenSpending data format). As each new file is released, we need to to clean it as we have cleaned the files before. If you are a confident programmer, you could write a script to handle this process. But what can the rest of us to to try to automate this process and make life a little easier.
One way is to use OpenRefine’s ability to “replay” cleaning scripts that you have generated before. Here’s an example of how to do just that…
Let’s start by loading the data in from a CSV file on the Isle of Wight local council website – we need to copy the download link URL ourselves:
The recent spending files are in a common format (that is, they have been published according to the same template), which is something we’ll be relying on, so we could load multiple files in at once into one big data file, but in this case I’m going to take each file separately.
OpenRefine makes a good guess at the file format. One minor tweak we might make is to ignore any blank lines (OpenSpending doesn’t like blank lines!).
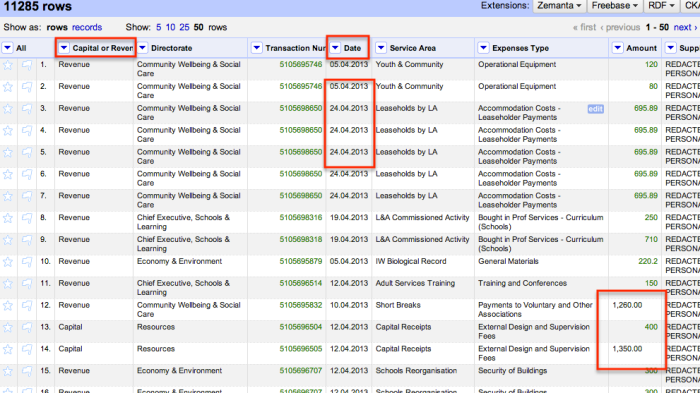
Here’s what the data looks like once we import it:
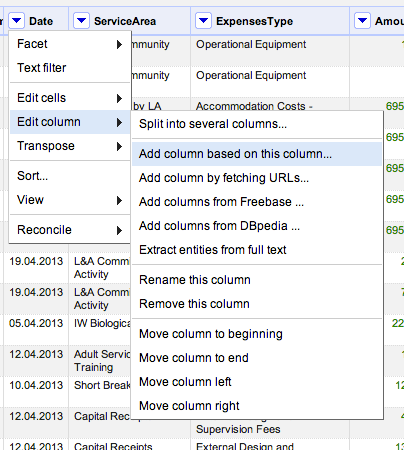
OpenSpending expects the data to be presented in a particular way, which is why we need to clean the data a little before we can upload it. For example, OpenSpending likes column names that are free of spaces and punctuation; it requires an amount column that just contains numbers (so no commas in the number to make it more readable!); it requires dates in the format 2013-07-15 (that is, the yyyy-mm-dd format) (and I think it needs this column to be called time?).
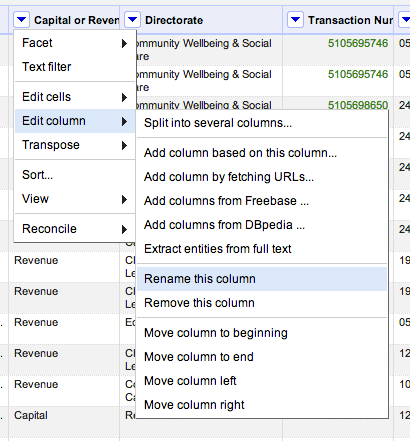
Here’s how we can rename the columns:
Rename each column in turn, as required – for example, remove any punctuation, use camelCase (removeing spaces and using capital letters to make work boundaries), or replace spaces with underscores (_).
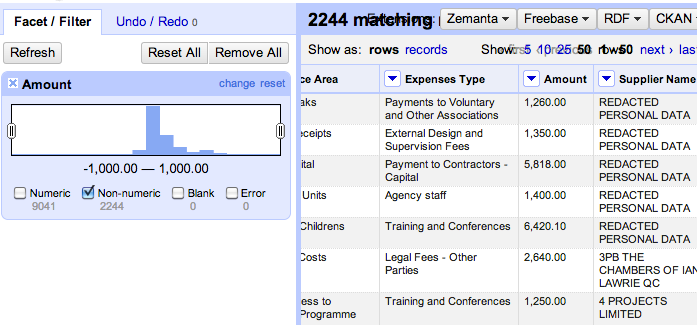
Let’s look at the amount column – if we select the numeric facet we can see there are lots of things not identified as numbers:
We can preview what the non-numeric values are so we can set about tidying them up…
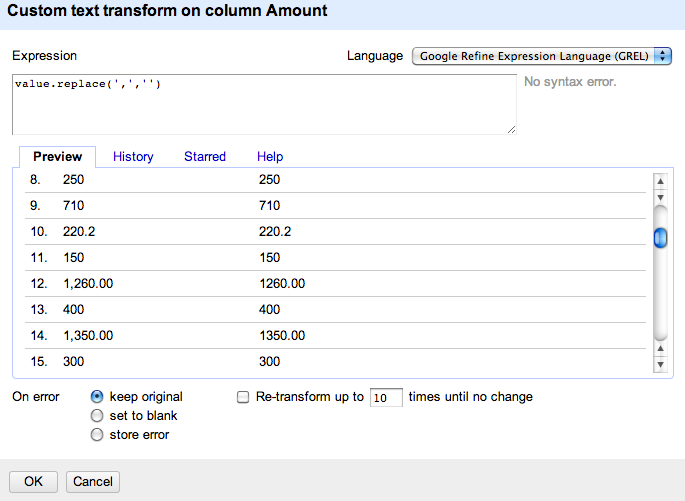
So commas appear to be the major issue – let’s remove them by transforming cells in that column that contain a comma by removing the comma.
We can do this by replacing a comma whenever we see one with nothing (that is, an empty character string) – value.replace(',','')
Let’s see what effect that has on the numeric facet view:
Well that seems to have worked – no non-numerics any more… (We might also use the sliders in the numeric facet to check the outlying values to see if they are plausible, or look like they may be errors.)
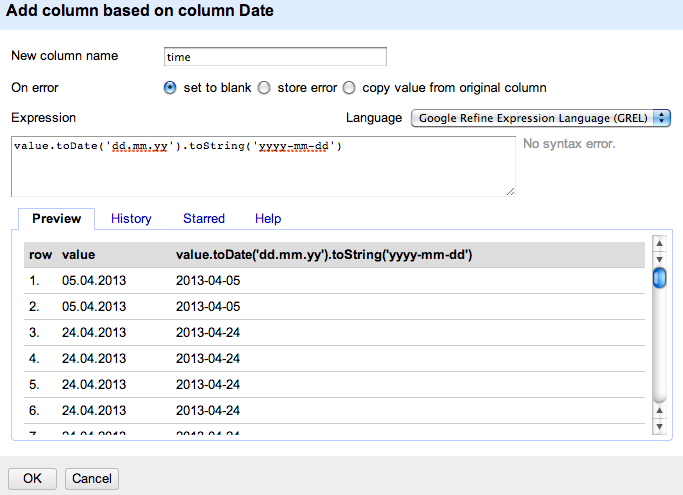
As far as a the dates go, we have dates in the form 17.04.2013 rather than 2013-04-17 so let’s transform them into the required format. However, because there is more scope for things going wrong with this transformation, let’s put the transformed data into a new column:
Here’s how we define the contents of that column:
That is: value.toDate('dd.mm.yy').toString('yyyy-mm-dd')
The first part – value.toDate('dd.mm.yy') interprets the string as a date presented in a given format, and then transforms that data into the rewquired date format: .toString('yyyy-mm-dd')
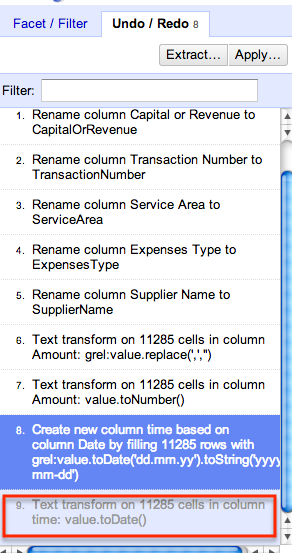
We can quickly preview that this step has worked by transforming the column to a date type:
and then preview it using a timeline facet to check that all seems in order.
(If there were non-date or error elements, we could select them and look at the original date and transformed date to see where the problem may lie.)
We don’t want the date formatting for out OpenSpending data file, so we can undo the step that transformed the data into the timeline viewable date format:
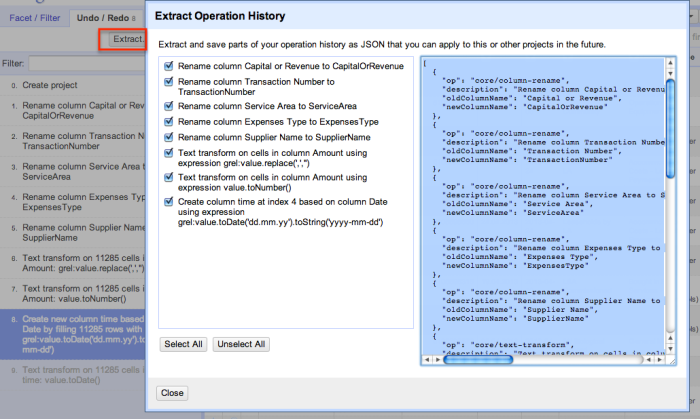
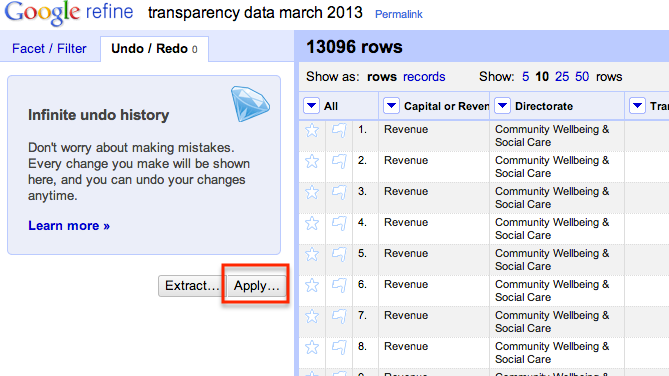
So now we have our cleaned data file. How can we apply the same steps to another month? If you look at the history tab, you will see it offers an “Extract” option – this provides a history of the change operations we applied to the dataset.
If we copy this history to a text file somewhere, we can then make use of it again and again.
To see how, open another OpenRefine project and import the data for another month (such as this one). When you have created the project, click on the Undo/Redo history tab and select Apply:
Paste in the transformation script we grabbed from the previous project:
Here’s the script I used – https://gist.github.com/psychemedia/6087946
When we apply the script, the data is cleaned using the same operations as previously:
That is, as long as the new data file is in the same format as the previous one, and only requires the same cleaning operations, we don’t really have much to do – we can just reuse the script we generated the first time we cleaned a file of this type. And each time a new file is published, we have a quick recipe for cleaning it up so we can get it into OpenSpending:-)
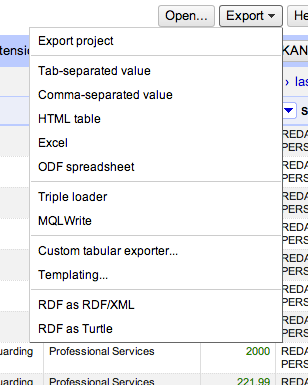
Finally, we can export the data for use as required…
Magic:-)
]]>


