Although more and more data is being published in an open format, getting hold of it in a form that you can quickly start to work with can often be problematic. In this post, I’ll describe one way in which we can start to make it easier to work with data sets from remote data sources such as the World Bank, the UN datastore and the UN Population division from an IPython Notebook data analysis environment.
For an example of how to run an IPython Notebook in a Chrome browser as a browser extension, see Working With Data in the Browser Using python – coLaboratory. Unfortunately, of the wrappers described in this post, only the tools for accessing World Bank Indicators will work – the others currently require libraries to be installed that are not available within the coLaboratory extension.
The pandas Python library is a programming library that provides powerful support for working with tabular datasets. Data is loaded into a dataframe, the rows and columns of which can be manipulated in much the same way as the rows or columns of a spreadsheet in a spreadsheet application. For example, we can easily find the sum of values in a column of numbers, or the mean value; or we can add values from two or more columns together. We can also run grouping operations, a bit like pivot tables, summing values from all rows associated with a particular category as described by a particular value in a category column.
Dataframes can also be “reshaped” so we can get the data into a form that looks like the form we want to be.
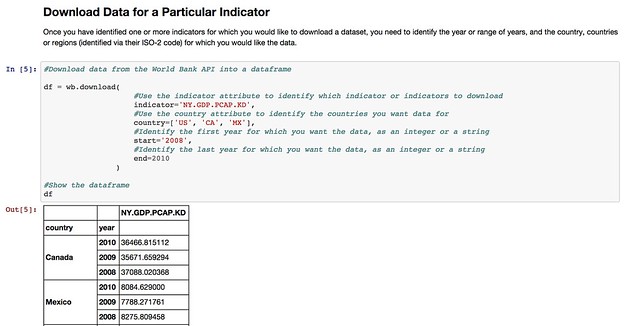
But how do we get the data into this environment? One way is to load in the data from a CSV file or Excel spreadsheet file, either one that has been downloaded to our desktop, or one that lives on the web and can be identified by a URL. Another approach is to access the data directly from a remote API – that is, a machine readable interface that allows the data to be grabbed directly from a data source as a data feed – such as the World Bank indicator data API.
On most occasions, some work is needed to transform the data received from the remote API into a form that we can actually work with it, such as a pandas dataframe. However, programming libraries may also be provided that handle this step for you – so all you need to do is load in the programming library and then simply call the data in to a dataframe.
The pandas library offers native support for pulling data from several APIs, including the World Bank Development Indicators API. You can see an example of it in action in this example IPython notebook: World Bank Indicators API – IPython Notebook/pandas demo.
Whilst the World Bank publishes a wide range of datasets, there are plenty of other datasets around that deal with other sorts of development related data. So it would be handy if we could access data from those sources just as easily as we can the World Bank Development Indicators data.
In some cases, the data publishers may offer an API, in which case we can write a library a bit like the pandas remote data access library for the World Bank API. Such a library would “wrap” the API and allow us to make calls directly to it from an IPython notebook, getting the data back in the form of a pandas dataframe we can work with directly.
Many websites, however, do not publish an API – or occasionally, if they do, the API may be difficult to work with. On the other hand, the sites may publish a web interface that allows us to find a dataset, select particular items, and then download the corresponding data file so that we can work with it.
This can be quite a laborious process though – rather than just pulling a dataset in to a notebook, we have to go to the data publisher’s site, find the data, download it to our desktop and then upload it into a notebook.
One solution to this is to write a wrapper that acts as a screenscraper, which does the work of going to the data publisher’s website, find the data we want, downloading it automatically and then transforming it into a pandas dataframe we can work with.
In other words, we can effectively create our own ad hoc data APIs for data publishers who have published the data via a set of human useable webpages, rather than a machine readable API.
A couple of examples of how to construct such wrappers are linked to below – they show how the ad hoc API can be constructed, as well as demonstrating their use – a use as simple as using the pandas remote data access functions show above.
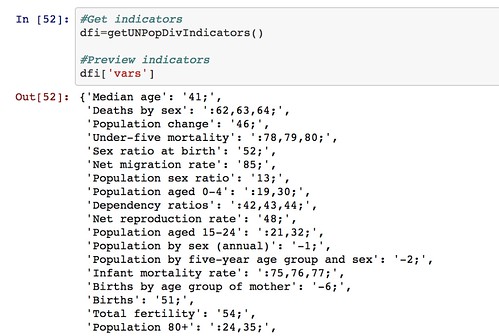
- The UN Department of Social and Economic Affairs Population Division on-line database makes available a wide range of data relating to population statistics. Particular indicators and the countries you require the data for are selected from two separate listboxes, and the data is then downloaded as a CSV file. By scraping the contents of the list boxes, we can provide a simple command based interface for selecting a dataset containing data fro the desired indicators and countries, automatically download the data and parse it into a pandas dataframe: UN Population Division Data API.
So for example, we can get a list of indicators:
We can also get a list of countries (that we can search on) and then pull back the required data for the specified countries and indicators.
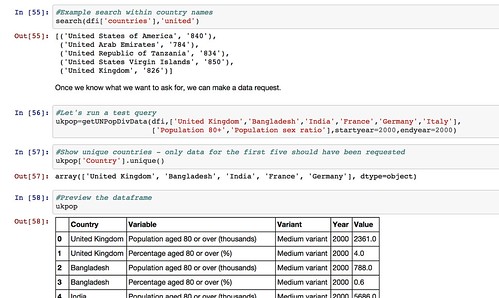 .
.Note that the web interface limits how many countries and indicators can be specified in any single data download request. We could cope with this in our ad hoc API by making repeated calls to the UN website if we want to get a much wider selection of data, aggregating the results into a a single dataframe before presenting them back to the user.
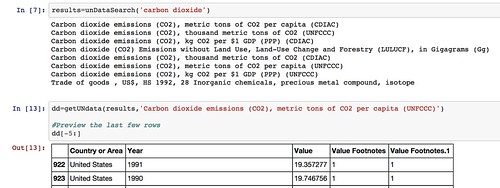
- The UNdata website publishes an official XML API, but I couldn’t make much (quick) sense of it when I looked at it, so I made a simple scraper for the actual website that allows me to request data by searching for an indicator, pulling back the list of results, and then downloading the data I want as a CSV file from a URL contained within the search results and parsing it into a pandas dataframe: UNdata Informal API.
By using such libraries, we can make it much easier to pull data into the environments within which we actually want to work with the data. We can also imagine creating “linked” data access libraries that can pull datasets from multiple sources and then merge them together – for example, we might pull back data from both the World Bank and the UN datastore into a single dataframe.
If there are any data sources that you think are good candidates for opening up in this sort of way, so that the data can be pulled more easily from them, please let us know via the comments below.
And if you create any of your own notebooks to analyse the data from any of the sources described above, please let us know about those too:-)
![]()
One comment that I’ve heard a few times about the online modules we currently have is that they’re very text-heavy. So, I did some research into other ways of putting learning materials online; for example, via slide decks – like Michael’s course on Extracting information from PDFs.
But, sometimes (especially when following step-by-step instructions) it helps to be able to see them all at once on a screen, so that you can see where you went wrong, or figure out where you’re going, rather than having to scroll backwards and forwards through slides.
I found a couple of good examples from Guardian Data of #datavines, which they used to illustrate GCSE results from 2013, like this one:
I like the idea of having vines focused on just one figure or fact, and I was very happy to find this tutorial from Twitter, on “How to tell a numbers driven story in six seconds” (incidentally, written by Simon Rogers who used to be at Guardian Data). He includes three key tips at the end of this blogpost there:
Our three tips when making data-driven Vine videos: Keep it simple: one big number is enough for each one Make the idea behind the video memorable – but don’t over-complicate it. Does it support the story? Remember Vine’s unique ability to loop – people will watch this again and again so try to create something that circles seamlessly
In addition to these tips, and the other advice in Simon’s blog post, here are some addition things I’ve learned from my very basic attempts at making data vines. Bear in mind the materials I’ve used have been the ever so rudimentary collection of paper, post it notes and pens!
- Don’t change shot too often — personally, I find using one sheet of paper as a background to be the easiest to follow
- Leave enough time for people to read and take in what is in that particular frame before changing
- Don’t try and convey too much information – six seconds isn’t very much!
- Vine’s ‘ghost tool’ is amazing. I tried using a different app to start with (Loopc.am) as Vine was having some issues on my phone, but thanks to the ‘ghost tool’ as well as the other editing features, I’m a big convert.
Here are the vines which I made: one for World Refugee Day, and another one (using Loopc.am) which tries to break down what we mean by ‘aid’.
One thing I found especially tricky in this one was the timing- I wanted to get exactly 4 seconds, or at least evenly spaced frames, but it was tricky without being able to see how far through (in seconds) I was through the total Vine length.
As my colleague Mariel accurately pointed out – the idea is not to substitute but rather duplicate for guaranteed learning. There’s no way that a looped video could properly replace chunks of text in terms of learning materials, but I hope that adding some more animations like this might make the modules easier to follow, or more interesting.
** Are there other ways of presenting learning materials online that we should be thinking about?*
Screencasts have been suggested, or including more pictures and illustrations in amongst the text. In a way, I like the clearly ‘human’ aspect of the vines, especially when they are handwritten, as well as the fact that they are very easy to begin making (at least, at my very basic level!) I’d love to know whether they add anything to the content from an audience perspective though – what do you think?
Leave your thoughts/ideas/suggestions/links in the comments below, or tweet them to @SchoolofData or @zararah.
Thank you!
![]()

We’re very happy to launch today a new website for the Open Development Toolkit, which which includes a number of new features to help people make use of, and contribute to, the project.
When the project began in early 2014, the project brief was fairly open; since then, after speaking to various members of the Open Development community, attending events such as the IATI TAG meeting, and doing a thorough assessment of what is already going on in the community, we’ve narrowed down the project aims, and target audience, considerably. With regards to the target audience, we’re now considering two main, broad demographics: data users, and development agencies/donors.
By ‘data users’, we’re considering primarily infomediaries in aid recipient countries; civil society and journalists, who could be using development data in their work. They’re in a position to be able to understand the data with local context, and convey their findings to their communities in an effective way. We want to make it as easy as possible for them to find and use aid data portals that already exist, as well as develop their technical skills in accessing, and using, raw aid data to facilitate their work.
With regards to development agencies and donors, we’re looking specifically at those who are thinking of making their data available online; rather than building new portals from scratch and creating proprietary tools, we’d like to encourage them to build upon what has already been created, share and take into account lessons learned, and contribute to the community with their tool/portal creation. Especially where tools have been built with public funds (eg. development arms of governments) we see no reason for these tools to remain closed source and proprietary.
Tools
The new site includes a curated list of Tools, which allow the user to understand, visualise or access aid data in various ways. Each ‘Tool’ presented on the site with a short description of what it does, along with its main strengths and weaknesses, and each one is classified with a number of tags, stating the perceived skill level required (beginner, intermediate, or advanced), the data source used by the tool, as well as its ‘theme’ (eg. global overview, donor specific, recipient country, donor government). The tagging system allows users to search for tools by what they’re wanting to focus on – for example, looking into the activities of a certain donor agency, or taking a closer look at projects taking place in a particular aid recipient country.
Each tool also has a second tab, explaining how the tool was made. We’re putting special focus on the tools which are already open source, and by putting the name of the developer(s) who have worked on these tools along with their contact details, we hope to make it as easy as possible for more work to be commissioned which will build upon their expertise.
Community
Another focus of the site is to bring together people who have worked on building the tools from a technical perspective, along with people working in development agencies, and the potential users of the data; the whole ‘development data’ ecosystem, in a way.
On the Community page, anyone active in the Open Development space is encouraged to create a profile, (for now, via filling in this Google form), with their contact details and a short biography, either as an individual or as an organisation. Activities of organisations and individuals can be seen on their profile pages, for example, tools that they have built or contributed to, blog posts that they have written, and people/organisations with whom they have collaborated.
We hope that highlighting the work that people have done within the Open Development community, along with their collaborations, will facilitate further collaboration, and encourage organisations to call upon community expertise when developing new tools.
Training
As well as displaying the tools and work that have already been created within the community and encouraging collaboration, we also want to support civil society and journalists to get the skills they need to use development data in their work, as mentioned above. We’ll be doing this by working with School of Data to create an Aid Curriculum, made up of various modules on technical skills required to work with aid data.
Ideally, we’d like to build upon training materials that have already been created in the sector, and make them available for remixing and reuse by others in the future; we’ll be encouraging people to try them out in workshops and training sessions, and we’d love to get feedback on how they have best been used, so we can iterate and improve upon them in the future. The curriculum will also be available online for people to work through at their own pace.
Blog
Last, but not least – the site includes a blog, where we’ll be posting on topics such as uses of development data by civil society or journalists, lessons learned during the software development of data portals, and other issues surrounding data use within the global development sector. We welcome submissions to the blog – take a look here to see other topics, and how to contribute.
Feedback on the site is most welcome – either open an issue on Github or drop an email to [email protected].
![]()

Colleagues at Development Initiatives come to me to find out how/where to get the data they need, to convert it into a format they can work with, and to manipulate the data.
A common issue that I come across is people coming to me with PDFs, and needing the data in a reusable format; it’s an old problem, and it’s getting boring!
I normally work directly with the IATI Datastore, but for people with less technical knowledge, there’s a number of problems with it. Even before you get to the technical skills needed to manipulate the data, even the language used isn’t useful for the average layperson: the words and terms used assume that people will understand and know what an ‘activity’, or a ‘transaction’, or a ‘budget’ is, as the very first step, for example. Then it’s difficult to know what you need in order to answer your question or even if it’s possible to answer what you’re looking for with data from the IATI datastore.
I usually point people towards donor portals, if they know who they want the data from—DFID’s DevTracker for example, or the UNDP’s open data portal. My colleagues also had a two-day training on using the OECD data, so now they can access this data themselves without any problems; this was really useful for them.
From my experience, people don’t often need disaggregated figures or even detailed geocoded data. They’re more interested in big aggregated figures that they can use in a ‘headline’ style, rather than the small, detailed data. For example, the level of knowing how much is being spent in a certain country within a certain sector is adequate, or how much a certain donor is spending in a certain country.
There was one time that a colleague of mine wanted to know how much money was being spent on HIV/AIDS prevention + support in Western Kenya, but we couldn’t find anything. We looked at the IATI datastore, directly on the Global Fund site, but we didn’t get anything.
If you are working with aid data in your work, we’d love to hear from you! Get in touch with zara.rahman[at]okfn.org, or drop @OpenDevToolkit a line on Twitter; your input would be so valuable to help us understand what we can best do to support you in your work!
![]()
Despite the new bill imposing life sentences for gay sex and same-sex marriage, Uganda’s Health Minister has encouraged people to fully disclose their sexual orientation to health workers, who will “live up to their ethics of keeping confidentiality of their patients”. Unsurprisingly, aid charities are warning the new bill will have “disastrous” effects on the country’s response to HIV.
So how might this affect aid flows to Uganda? Are there donors who have been funding campaigns or activities fighting for homosexual rights, and given the implications of the bill on healthcare, what kind of aid does Uganda receive for its health sector? Using only tools designed to help make IATI data accessible – rather than raw IATI data – will we see how many of those questions can be answered here.
Aid flows to Uganda: a summary
To get a general overview of aid to Uganda, we used AidView, which pulls data from the IATI Registry. Using the ‘Filter by Country’ option, we can see that Uganda received a total of $9 billion in aid and has 1,105 activities funded. It’s unclear, however, for what timescale this value is applicable; for just the past year, or the current year? A total of $9 billion seems highly unlikely to be for just one year – so we’ll assume it’s all IATI activities, though this is not so helpful.
Choosing to view these activities by list (much more user-friendly than ‘view as bubbles’) brings up the entire list, but it shows only 20 activities per page.
By using the Filter by Sector option, which works on top of the Country Filter, we can see a selection of 32 different ‘sectors’, again in bubble format. Nothing specifically about gay rights is mentioned in any of these sector categorisations, but there are some ambiguous sectors, such as “Unallocated/Unspecified”. A quick scan through this list didn’t bring anything relevant up, and likewise for Government and Civil society.
But while gay rights specifically doesn’t seem to be mentioned in aid activities in Uganda, activities centred around health certainly are.
Health aid
According again to the Sector Filter from AidView, a total of $165 million was spent in health aid activities, through 37 activities (again, the timescale for these activities is unclear). Interestingly, the only health projects here that are focused on HIV / AIDS are majority funded by the UK, though some in partnership with other multilateral donors such as this project to improve delivery of HIV Prevention Services between the UNDP and the UK’s Department for International Development.
Through the ‘data file’ option with the two filters of Uganda and Health on, it’s also clearly shown that the UK is/was by far the biggest donor in terms of health aid, providing 62.5% of the total health budget, followed by the World Bank’s International Development Association with 25.6%. According to this data, none of the countries who have said they will withhold aid from Uganda are currently funding any health-related projects in the countries.
Aid flows from the UK
On the UK’s aid data site, DevTracker, we can easily see through the Uganda Country Profile a number of key statistics – nearly £106 million was spent in Uganda 2013, which works out at 1.06% of the total UK aid budget. Though one of their priorities is stated as “protecting the poorest and most vulnerable”, they don’t appear to have any project specifically working on gay rights.
But given the information shown in AidView above, looking at activities in Uganda in the Health sector also brings up some relevant aid projects, and we can see via DevTracker that 23.18% of the UK’s aid budget to Uganda is spent on health. A couple of projects appear in DevTracker that don’t show up in AidView, such as “an Integrated Youth-Led HIV Prevention & Livelihood Project”.
Looking at the bigger picture briefly, the only project anywhere in the world funded by the UK government that appears to be supporting gay rights is the “Global Fund for Men who have sex with Men”, with a budget of nearly 1 million GBP and the project description “to contribute to ensuring equitable access to effective HIV prevention, care, and treatment services tailored to the needs of gay men and other men who have sex with men”. Assuming the fund was active in areas of the world which might have homophobic laws in place, it sensibly has ‘No Country Specified’, so we don’t know if the project has been active in Uganda.
Aid flows from the Netherlands
The Netherlands, alongside Denmark and Norway, has also announced that they will be cutting aid. Looking at the aid portal from the Netherlands, OpenAid.nl, we can see a list of activities, but unfortunately no totals or summaries of how much aid is spent. While there is also a “sector filter” – with much more detailed categories than the previous tools – the lack of functionality to see aggregated totals here means that it’s not possible to see how much is spent in Uganda in total, nor by sector.
In conclusion
Using only IATI data tools, it’s been fairly difficult to get an overall view of the aid flows into Uganda. AidView provides good summaries, but without time periods, the data given is without context. Note, though, that AidView is still in prototype stage, so perhaps this feature will be coming later. Also, given that the data in IATI does not (yet!) cover all aid activities from all countries, it’s difficult to know what conclusions can be drawn directly from the data provided – for example, US aid to Uganda didn’t show up in AidView, giving the misleading impression that the UK was the biggest donor.
In fact, when trying to get an idea of aid flows to Uganda, the most convincing figure of total amount of aid received by Uganda was from a PDF report produced by Development Initiatives, which states that Uganda received US$1.6 billion in 2011, with the US as the largest funder. In total, almost a third of Official Development Assistance (ODA) is spent on health, and 75% of ODA spent on health is provided by the US, the UK, and the Global Fund. So here it’s clear that the countries which have announced that they will be cutting aid aren’t large contributors to health assistance within Uganda.
The amounts of aid declared by Norway and Denmark that will be withdrawn, which comes to a total of $17 million, is (taking the figure of what was received in 2011) just 1.06% of what Uganda receives in Official Development Assistance; too small, then, to provide any real pressure upon the government.
But ODA as a whole forms a considerable 8.04% of the country’s GDP, which stood at $19.88 billion in 2012. If, for example, the top 10 largest donors (who between them provide $1.4billion of the total $1.6 billion) were to decide to redirect or withhold aid flows to Uganda as a result of the law, the impact would be much higher.
No judgement is made on whether this decision would be the right one in terms of the effect on the Ugandan people or as a pressure tool – this was simply an exercise in seeing what could be found out from data available online about Ugandan aid flows.
Have we missed anything? Drop @OpenDevToolkit a line if so!
![]()
Startups are getting interested in remittances (and check out number 15 in this list, too). In many countries – especially those lacking formal banking systems – remittances sent back to home countries by immigrants living in other countries rivals, or in some cases is considerably more than, international aid flows to the country. The World Bank estimated that remittances to low-income countries in 2011 came to a total of $351 billion, whereas Official Development Assistance from OECD countries came to $133.5 billion.
Somaliland vs Somalia: great new paper on an extraordinary ‘natural experiment’ in aid and governance. Oxfam have reviewed Sarah Phillips’ new paper which compares Somalia to its neighbour Somaliland and which includes some uncomfortable truths. The fact that Somaliland is not internationally recognised has meant that it receives practically no direct financial aid, for example. Check out their blog for more, or read the paper directly.
Just in time for International Women’s Day, Patrick Meier compiled this inspiring list of Women in Crisis Mapping. Did you know that the vast majority of volunteers engaged in the Ushahidi-Haiti Crisis Map project (January 2010) were women? Same goes for the Ushahidi-Chile Crisis Map of March 2010. Hats off to you all!
The OECD’s Jon Lomøy is pushing for the development community to ‘get smart with aid’. What does that mean? Taking into account how the world has changed, for one; recognising and responding to vast diversity within low-income countries rather than taking a ‘one size fits all’ approach; working more closely with other global issues such as climate change; and learning from our mistakes, to name just a few of his poignant suggestions. The article also includes an interactive aid visualisation (another one to add to the list!).
The World Bank launched their webinar series, “How Can Technology Accelerate Citizen Engagement?”, starting by looking at “Maximizing the Impact of Mapping and Crowdsourcing”. It was open to the public and by all accounts a really useful webinar. We’ll be on the lookout for future events.
Linda Raftree has written up the activities of the recent NYC Technology Salon, looking into “Bigger, better data and resilience”. The post is full of thinking points, first defining the terms used, the links between the issues, and tackling briefly the age-old issue: can big data really ’empower’ people? She also touches upon the need for responsible use of data in terms of using it as a decision-making tool. In cases such as international development, the ethical risks coming from misinterpretation and consequently inaccurate (or in some cases harmful) decision-making are huge. All in all, the NYC Technology Salon sounds like it was a great event with a wide range of topics covered—more on the Salons here.
Following the recent Mobile World Congress 2014, Nancy Ngo has written up 4 Takeaways for Developing Countries. While there are some interesting insights, the complete lack of privacy or security mentions, especially around these mobile technologies which are collecting enormous amounts of data, is unsurprising but worrying.
The very first map of Nairobi’s informal ‘matatu’ transit system has been produced, thanks to students who rode every matatu route in the city and catalogued the stops along the way. The maps reveal that the seemingly chaotic system is in fact “remarkably standardized” and detailed, with over 102 different routes. The data has been made fully open, with the government responding well, private companies already using the data, and citizens being able – for the first time ever – to see and understand their city’s transit system. Download the map here and read more on the project here.
Got more interesting blogs, projects, or articles from the past couple of weeks? Let us know @OpenDevToolkit!
![]()
Within the area of humanitarian data, the data that is most readily available is that surrounding funding. This means that, for lack of more accurate data (or a more accurate way to measure this), the level of assistance provided (ie. what people receive) is measured in terms of funding provided. As stated in the report, “there is currently no standardised reporting on the services provided or their impact – especially over the long term.”
This way of considering funding to a country to be an accurate measurement of the benefits that people are receiving is, as they admit numerous times, seriously flawed. There’s no way to know whether the money is going to the places and people who need it the most, how this money is used within communities, and – if it is, at least on a high level, arriving at the countries most in need – whether the funds are actually having a positive impact on recipients’ lives.
The variety of sources providing international humanitarian assistance was also interesting. While the total level of Official Development Assistance came to 26 billion USD (within humanitarian assistance only), the total amount of remittances was almost double this at 51 billion USD. Remittances to low and lower-middle income countries has increased fourfold over the past decade, and yet this is an area which doesn’t receive much attention within the international sphere. Exceptions exist, of course – such as when Barclays decided to close a number of accounts in Somalia – though these have tended to be peaks of international activity around major news items rather than a longer-term focus.
As mentioned, the technical limits of humanitarian data are highlighted throughout. A lack of common data standards or protocols between humanitarian organisations limits the extent to which organisations can share their information, assuming they would want to. Potential problems in terms of sharing data were also highlighted; political as well as practical conditions have to be taken into account, given the chaotic nature of crises, and some actors might not be able or willing to share information that they collect (whether that be for political or security reasons).
The report mentioned that appeals for funding were, on average, just 62% funded by the end of the year, but with no mention of the decision-making process that feeds into this. For example, in 2012, Liberia was the worst funded appeal (receiving 38% of what was requested) and Zimbabwe was the best funded (88%). It would be interesting to investigate if there were any media correlations in this trend; i.e. did Zimbabwe feature more heavily than Liberia in international media, raising awareness internationally and potentially resulting in a better funding response?
There were also some frank admissions within the report:
At the global level, we do not fully understand the relationship between what people need and the assistance they eventually get, which also depends on what resources are available, how they are prioritized by donors and aid organizations, and how effective assistance programmes are.

Another admission came illustrated with this graph of assistance levels provided to the Sahel
along with levels of malnutrition. Despite levels of official development assistance peaking hugely in 2006, it’s unclear whether this had a direct affect upon levels of malnutrition in the country, and levels of undernourishment have continued to decline at a steady rate, despite (or because of?) aid flows.
The solution suggested here:
In particular, the model of short term responses to recurrent crises has not led to long term improvements for affected people. Moving to an approach where humanitarian and development sectors work together to provide better-targeted aid that can build the resilience of vulnerable communities to climate and other shocks is a promising alternative.
This suggestion was further backed up by the fact that half of the funds within humanitarian aid were used to provide food, i.e. an unsustainable (but urgently needed) form of aid, clearly focused on emergency response. The report also stated that less than 1% of development funding is spent on “crisis preparedness and prevention”, highlighting a lack of strategy coordination between development funds and humanitarian aid funds.
This is the theme that resonated the most for me throughout: the need for international development and humanitarian aid to connect more over their activities to ensure the best possible outcome for those in need of aid of all kinds. This sharing and collaboration over both long-term and short-term strategies and activities between humanitarian and development actors – who are often working in the same countries – is essential, and technology and open data should, at least in theory, help us towards that goal.
![]()
The post first appeared on Open for Change’s blog last August. Many of the tools mentioned here are still relevant, and we like it as an introduction to the wide variety of IATI tools out there!
In the aid development sector, there is a little buzz going around about the International Aid Transparency Initiative (IATI) standard, which sets guidelines for publishing aid data. So data is stored and published in a machine-readable format so that it’s easier to find, use and compare.
But what does this data look like, and how can you visualise it?
Project information published in the IATI standard is in XML format, which looks like this:

Which is really cool for, let’s say, “geeks”.
I, with limited technical knowledge (I know some cool Excel tricks and always like to think I have some computer skills), have to admit that I am a noob when it comes to coding. I can read the IATI XML because I know how it is built up, but play around with it and make my own visualizations? These are skills I lack.
John Adams (DFID) wrote a great blog about visualising an IATI XML file with the use of three tools. But a warning: technical skills required! If you have a more-than-average knowledge of data, I would definitely recommend you read the blog and check out these tools.
If you’re like me and your technical skills aren’t up to that level (yet), there is an increasing number of visualisation tools for IATI data available where you can just have a browse around the data in a ‘non-geek’-friendly manner.
But how do you find these visualizations?
The IATI registry gives you a link to a few applications using IATI data, but definitely not to all. Below is a list of the ones I found browsing the Internet and working with open data and IATI in my work for Akvo and Open for Change. There are probably more, and I’d love it if you’ll add them as a comment so we can get a more complete list. I will just list them and not give my opinion about them, because I feel that you should explore them yourself and that my opinion is something for a different blog.
Country/organisation Portals using IATI data
- Openaid.nl – Visualising the Dutch IATI dataset and piloting on combining IATI data with Akvo Really Simple Reporting projects (RSR) to give more in-depth project information.
- DFID development tracker – Visualising the IATI dataset for the UK, plus visualising other datasets like DFID’s annual report.
- Openaid.se – Visualising the Swedish IATI dataset and combining it with historical data from OECD DAC and country information.
- UNDP Open Aid Data Portal – shows UNDP IATI data.
- Open UN-Habitat – visualising IATI data from UN-Habitat and displaying city prosperity indicators historically and in forward-looking contexts (to 2050).
Browse trough all published IATI sets
- IATI explorer – Browse through all published IATI data.
- Open Aid Search – View all published IATI data on a map and filter and search it.
- Aidview – Filter through the published IATI data by sector, organisation, or country.
- Aidinfo flow – Relative distribution of total transaction value across each country is shown on a map.
- IATI: Benfords Law – Use Benford’s Law to analyze published IATI datasets.
- Transparency tracker – Check out what information organisations have published in the IATI standard and what the rest of their IATI roadmap holds.
- Open Spending – IATI data visualized in a tree map.
But open development data is not only about IATI. It is part of a bigger, broader transparency movement around open development, which also includes open source software, sharing knowledge, open organizations, open contracts, etc. Each plays a role in making development aid more transparent and can increase accountability, efficiency, and effectiveness.
That’s why I want to list some other great and inspirational visualization tools using this open development data—to show that IATI is only a part of a bigger and broader movement.
Other open aid data visualizations not using IATI data
- Aid data Chinese finance to Africa – Here you can track Chinese development finance to Africa.
- Openaid map – Maps made by the Open Aid Partnership, visualising the geography of aid in Bolivia, Kenya, Malawi, Moldova, and Nepal.
- Mapping4results – Visualizes the locations of World Bank-financed projects.
- Go Three60 – Developed by AmLab, Three60 shows how development aid works on every level from global to grassroots in a test case on maternal health in Uganda.
- Aidflows – Here you can search through OECD data.
- German Open Aid Data portal – Here you can see where German development money is being spent.
![]()