You are browsing the archive for Visualisation.

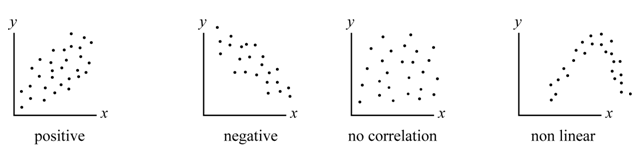
Breaking the Knowledge Barrier: The #OpenData Party in Northern Nigeria

- October 1, 2014 in Community, Data Expeditions, Data for CSOs, Events, Follow the Money, Geocoding, Mapping, Spreadsheets, Storytelling, Uncategorized, Visualisation

If the only news you have been watching or listening to about Northern Nigeria is of the Boko Haram violence in that region of Nigeria, then you need to know that other news exist, like the non-government organizations and media, that are interested in using the state and federal government budget data in monitoring service delivery, and making sure funds promised by government reach the community it was meant for.

This time around, the #OpenData party moved from the Nigeria Capital – Abuja to Gusau, Zamfara and was held at the Zamfara Zakat and Endowment Board Hall between September Thursday, 25 and Friday, 26, 2014. With 40 participant all set for this budget data expedition, participants included the state Budget Monitoring Group (A coalition of NGOs in Zamfara) coordinated by the DFID (Development for International Development) State Accountability and Voice Initiative (SAVI),other international NGOs such as Society for Family Health (SFH), Save the Children, amongst others.

IMAG1553

Group picture of participants at the #OpenData Party in Zamfara

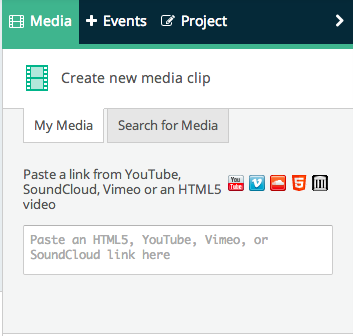
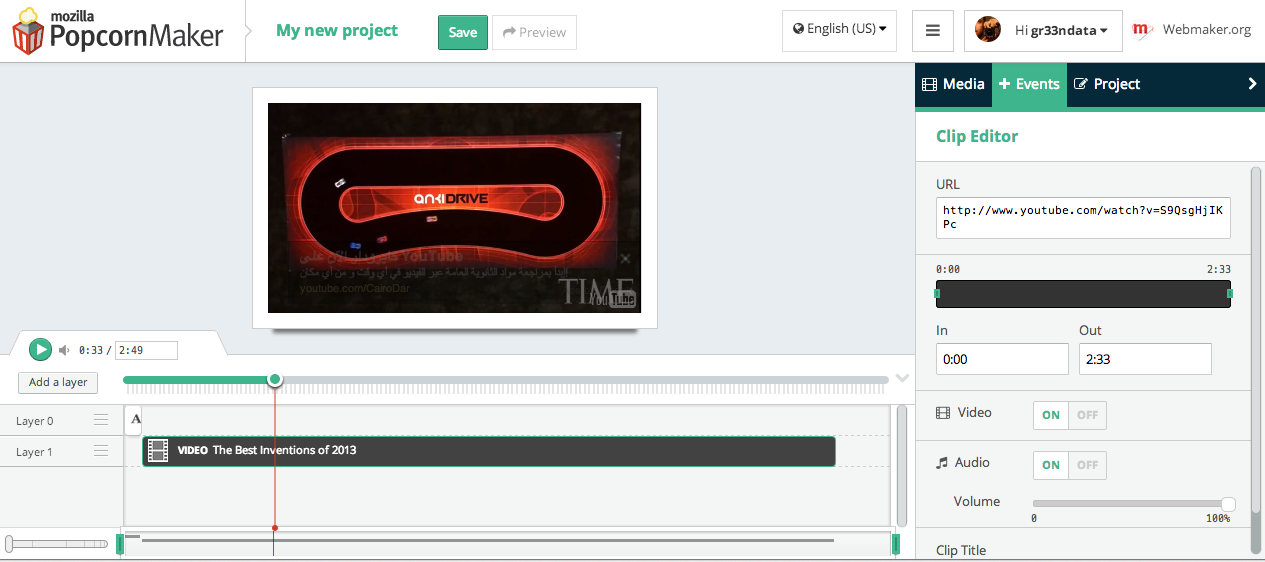
But how do you teach data and its use in a less-technology savvy region? We had to de-mystify teaching data to this community, by engaging in traditional visualization and scraping – which means the use of paper artworks in visualizing the data we already made available on the Education Budget Tracker. “I never believed we could visualize the education budget data of the federal government as easy as what was on the wall” exclaimed Ahmed Ibrahim of SAVI

IMAG1516

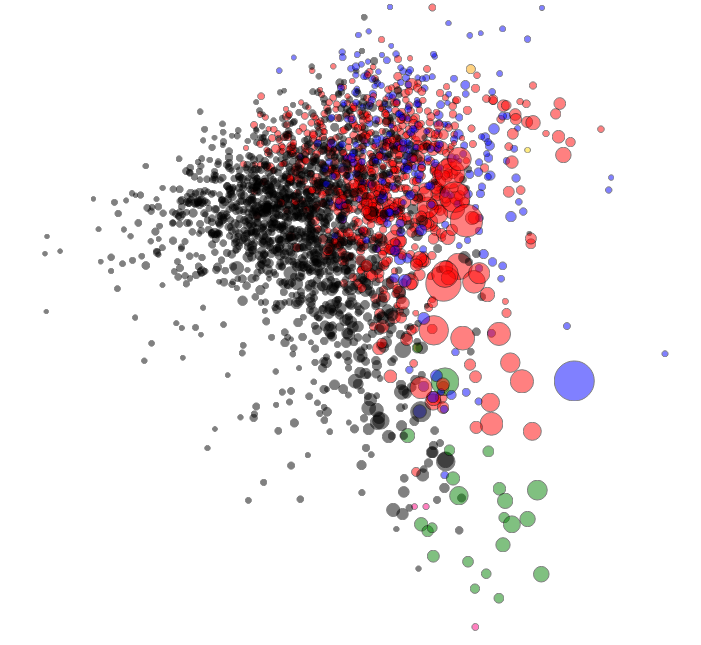
Visualization of the Education Budget for Federal Schools in Zamfara

As budgets have become a holy grail especially with state government in Nigeria, of most importance to the participants on the first day, was how to find budget data, and processes involved in tracking if services were really delivered, as promised in the budget. Finding the budget data of the state has been a little bit hectic, but with much advocacy, the government has been able to release dataset on the education and health sector. So what have been the challenges of the NGOs in tracking or using this data, as they have been engaged in budget tracking for a while now?

Challenges of Budget Tracking Highlighted by participants

Challenges of Budget Tracking Highlighted by participants

“Well, it is important to note that getting the government to release the data took us some time and rigorous advocacy, added to the fact that we ourselves needed training on analysis, and telling stories out of the budget data” explained Joels Terks Abaver of the Christian Association of Non Indigenes. During one of the break out session, access to budget information and training on how to use this budget data became a prominent challenge in the resolution of the several groups.

The second day took participants through the data pipelines, while running an expedition on the available education and health sector budget data that was presented on the first day. Alas! We found out a big challenge on this budget data – it was not location specific! How does one track a budget data that does not answer the question of where? When involved in budget tracking, it is important to have a description data that states where exactly the funds will go. An example is Construction of Borehole water pump in Kaura Namoda LGA Primary School, or we include the budget of Kaura Namoda LGA Primary School as a subtitle in the budget document.

Taking participants through the data pipelines and how it relates to the Monitoring and Evaluation System

Taking participants through the data pipelines and how it relates to the Monitoring and Evaluation System

In communities like this, it is important to note that soft skills are needed to be taught – , like having 80% of the participants not knowing why excel spreadsheets are been used for budget data; like 70% of participants not knowing there is a Google spreadsheet that works like Microsoft Excel; like all participants not even knowing where to get the Nigeria Budget data and not knowing what Open Data means. Well moving through the school of data through the Open Data Party in this part of the world, as changed that notion.”It was an interesting and educative 2-day event taking us through the budget cycle and how budget data relates to tracking” Babangida Ummar, the Chairman of the Budget Working Group said.

Going forward, this group of NGO and journalist has decided to join trusted sources that will be monitoring service delivery of four education institutions in the state, using the Education Budget Tracker. It was an exciting 2-day as we now hope to have a monthly engagement with this working group, as a renewed effort in ensuring service delivery in the education sector. Wondering where the next data party will happen? We are going to the South – South of Nigeria in the month of October – Calabar to be precise, and on the last day of the month, we will be rocking Abuja!

Flattr this!

Data Visualization and Design – Skillshare

- September 26, 2014 in Community, Events, HowTo, Resources, School_Of_Data, Storytelling, Visualisation

Observation is 99 % of great design. We were recently joined by School of Data/Code for South Africa Fellow Hannah Williams for a skillshare all about the data visualization and design. We all know dataviz plays a huge part in our School of Data workshops as a fundamental aspect of the data pipeline. But how do you know that, beyond using D3 or the latest dataviz app, you are helping people actually communicate visually?

In this 40 minute video, Hannah shares some tips and best practices:

Design by slides

The world is a design museum – what existing designs achieve similar things? How specifically do they do this? How can this inform your digital storytelling?

Resources:

Want to learn more? Here are some great resources from Hannah and the network:

Hannah shared some of her other design work. It is great to see how data & design can be used in urban spaces: Project Busart.


We are planning more School of Data Skillshares. In the coming weeks, there will be sessions about impact & evaluation as well as best practices for mapping.

Flattr this!

A Weekend of Data, Hacks and Maps in Nigeria

- September 16, 2014 in charity data, Data Cleaning, Data Expeditions, event, Mapping, maps, School_Of_Data, Spreadsheets, Visualisation

It was another weekend of hacking for good all around the world, and Abuja, Nigeria was not left out of the weekend of good, as 30 participants gathered at the Indigo Trust funded space of Connected Development [CODE] on 12 – 14 September, scraping datasets, brainstorming creating technology for good, and not leaving one thing out – talking soccer (because it was a weekend, and Nigeria “techies” love soccer especially the English premiership).

Participants at the Hack4Good 2014 in Nigeria

Participants at the Hack4Good 2014 in Nigeria

Leading the team, was Dimgba Kalu (Software Architect with Integrated Business Network and founder TechNigeria), who kick started the 3 day event that was built around 12 coders with other 18 participants that worked on the Climate Change adaptation stream of this year #Hack4Good. So what data did we explore and what was hacked over the weekend in Nigeria? Three streams were worked :

  1. Creating a satellite imagery tagging/tasking system that can help the National Space Research Development Agency deploy micromappers to tag satellite imageries from the NigeriaSat1 and NigeriaSat2
  2. Creating an i-reporting system that allows citizen reporting during disasters to Nigeria Emergency Management Agency
  3. Creating an application that allows citizens know the next water point and its quality within their community and using the newly released dataset from the Nigeria Millennium Development Goal Information System on water points in the country.

Looking at the three systems that was proposed to be developed by the 12 coders, one thing stands out, that in Nigeria application developers still find it difficult to produce apps that can engage citizens – a particular reason being that Nigerians communicate easily through the radio, followed by SMS as it was confirmed while I did a survey during the data exploration session.

Coders Hackspace

Coders Hackspace

Going forward, all participants agreed that incorporating the above medium (Radio and SMS) and making games out of these application could arouse the interest of users in Nigeria.  “It doesn’t mean that Nigerian users are not interested in mobile apps, what we as developers need is to make our apps more interesting” confirmed Jeremiah Ageni, a participant.

The three days event started with the cleaning of the water points data, while going through the data pipelines, allowing the participants to understand how these pipelines relates to mapping and hacking. While the 12 hackers were drawn into groups, the second day saw thorough hacking – into datasets and maps! Some hours into the second day, it became clear that the first task wouldn’t be achievable; so much energy should be channelled towards the second and third task.

SchoolofData Fellow - Oludotun Babayemi taking on the Data Exploration session

SchoolofData Fellow – Oludotun Babayemi taking on the Data Exploration session

Hacking could be fun at times, when some other side attractions and talks come up – Manchester United winning big (there was a coder, that was checking every minutes and announcing scores)  , old laptops breaking (seems coders in Abuja have old  ones), coffee and tea running out (seems we ran out of coffee, like it was a sprint), failing operating systems (interestingly, no coders in the house had a Mac operating system), fear of power outage (all thanks to the power authority – we had 70 hours of uninterrupted power supply) , and no encouragement from the opposite sex (there was only two ladies that strolled into the hack space).

Bring on the energy to the hackspace

Bring on the energy to the hackspace

As the weekend drew to a close, coders were finalizing and preparing to show their great works.  A demo and prototype of streams 2 and 3 were produced. The first team (working on stream 2), that won the hackathon developed EMERGY, an application that allows citizens to send geo-referenced reports disasters such as floods, oil spills, deforestation to the National Emergency Management Agency of Nigeria, and also create a situation awareness on disaster tagged/prone communities, while the second team, working on stream 3, developed KNOW YOUR WATER POINT an application that gives a geo-referenced position of water points in the country. It allows communities; emergency managers and international aid organizations know the next community where there is a water source, the type, and the condition of the water source.

(The winning team of the Hack4Good Nigeria) From Left -Ben; Manga; SchoolofData Fellow -Oludotun Babayemi; Habib; Chief Executive, CODE - Hamzat

(The winning team of the Hack4Good Nigeria) From Left -Ben; Manga; SchoolofData Fellow -Oludotun Babayemi; Habib; Chief Executive, CODE – Hamzat

Living with coders all through the weekend, was mind blowing, and these results and outputs would not be scaled without its challenges. “Bringing our EMERGY application live as an application that cuts across several platforms such as java that allows it to work on feature phones can be time consuming and needs financial and ideology support” said Manga, leader of the first team. Perhaps, if you want to code, do endeavour to code for good!


Flattr this!

Mapping Social Positioning on Twitter

- February 14, 2014 in Visualisation

Many of us run at least one personal or work-related Twitter account, but how do you know where your account is positioned in a wider social context? In particular, how can you map where your Twitter account is positioned with respect to other Twitter users?

A recent blog post by Catherine Howe, Birmingham maptastic, describes a mapping exercise intended “to support a discovery layer for NHS Citizen”. Several observations jumped out at me from that writeup:

The vast majority [of particpants] (have not counted but around 20/24 from memory) chose to draw diagrams of their networks rather than simply report the data.

So people like the idea of network diagrams; as anyone who has constructed a mind-map will know, the form encourages you to make links between similar things, use space/layout to group and differentiate things, and build on what you’ve already got/fill in the gaps.

We’ll need to follow up with desk research to get twitter addresses and the other organizational information we were after.

Desk research? As long as you don’t want too much Twitter data, the easiest way of grabbing Twitter info is programmatically…

I am not sure that we can collect the relationship data that we wanted as few of the participants so far have been able to include this with any great confidence. I am not sure how much of a problem this is if we are just looking at mapping for the purposes of discover[y].

So what’s affecting confidence? Lack of clarity about what information to collect, how to collect it, how to state with confidence what relationships exist, or maybe what categories accounts fall into?

We need to work out how to include individuals who have many ‘hats’. So many of the people we have spoken to have multiple roles within what will be the NHS Citizen system; Carers and service users are also often highly networked within the system and I think this needs to be captured in the mapping exercise more explicitly. I am thinking of doing this by asking these people to draw multiple maps for each of their contexts but I am not sure that this reflects how people see themselves – they are just ‘me’. This is an important aspect to understanding the flow within the discover space in the future – how much information/connection is passed institutionally and how much is as a result of informal or at least personal channels. This is perhaps something to consider with respect to how we think about identity management and the distinction between people acting institutionally and people acting as individuals.

People may wear different hats, but are these tied to one identity or many identities? If it’s a single identity, we may be able to identify different hats by virtue of different networks that exist between the members of the target individual’s own network. For example, many of the data folk I know know each other, and my family members all know each other. But there are few connections, other than me, joining those networks. If there are multiple identities, it may make sense to generate separate maps, and then maybe at a later stage look for overlaps.

Be specific. I need to make sure we are disciplined in the data collection to distinguish between specific and generic instances of something like Healthwatch. In the network maps people are simply putting ‘Healthwatch’ and not saying which one.

Generating a map of “Healthwatch” itself could be a good first step here: what does the Healthwatch organisation itself look like, and does it map into several distinct areas?

In another recent post, #NHSSM #HWBlearn can you help shape some key social media guidelines?, Dan Slee said:

You may not know this but there’s a corner of local government that’s has a major say in decisions that will affect how your family is treated when they are not well.

They’re called health and wellbeing boards and while they meet at Town Halls they cover the intersection between GPs, local authorities and patients groups.

They also have a say on spending worth £3.8 billion – an eye watering sum in anyone’s book. […]

Many of them do great work but there’s a growing feeling that they could do better to use social media to really engage with the communities they serve. So we’re helping see how some social media guidelines can help.

And maybe a mapping exercise or two?

One of the most common ways of mapping a social network around an individual is to look at how the followers of that individual follow each other. This approach is used to generate things like LinkedIn’s InMap. One issue with generating these sorts of maps is that to generate a comprehensive map we need to grab the friend/follower data for the whole friend/follower network. The Twitter API allows you to look up friend/follower information for 15 people every fifteen minutes, so to map a large network could take some time! Alternatively, we can get a list of all the followers of an individual and then see how a sample of those followers connect to the rest to see if we can identify any particular groupings.

Another way is to map conversation between individuals on Twitter who are discussing a particular topic using a specific hashtag. A great example is Martin Hawksey‘s TAGS Explorer, which can be used to archive and visualise hashtag-based Twitter conversations. One of the issues with this approach is that we only get sight of people who are actively engaged in a conversation via the hashtag we are monitoring at the time we are sampling the Twitter conversation data.

For Excel users, NodeXL is a social network analysis tool that supports the import and analysis of Twitter network data. I don’t have any experience of using this tool, so I can’t really comment any more!

In the rest of this post, I will describe another mapping technique – emergent social positioning (ESP) – that tries to identify the common friends of the followers of a particular individual.

Principle of ESP

The idea is simple: people follow me because they are interested in what I do or say (hopefully!). Those same people also follow other people or things that interest them. If lots of my followers follow the same person or thing, lots of my followers are interested in that thing. So maybe I am too. Or maybe I should be. Or maybe those things are my competitors? Or maybe a group of my followers reveal something about me that I am trying to keep hidden or am not publicly disclosing inasmuch as they associate me with a thing they reveal by virtue of following other signifiers of that thing en masse? (For more discussion, see the BBC College of Journalism on how to map your social network.)

Here’s an example of just such a map showing people commonly followed by a sample of 119 followers of the @SchoolOfData Twitter account.

schoolofdata

From my quick reading of the map, we can see a cluster of OKF-related accounts at the bottom, with accounts relating to NGOs around the 7 o’clock position. Moving round to 10 o’clock or so, we have a region of web publications and technology news sites; just past the 12 o’clock position, we have a group of people associated with data visualisation, and then a cluster of accounts relating more to data journalism; finally, at the 3 o’clock position, there is a cluster of interest in UK open data. Depending on your familiarity with the names of the Twitter accounts, you may have a slightly different reading.

Note that we can also try to label regions of the map automatically, for example by grabbing the Twitter bios of each account in a coloured group and running some simple text analysis tools over them to pick out common words or topics that we could use as interest area labels.

So how was it generated? And can you generate one for your own Twitter account?

The map itself was generated using a free, open-source, cross-platform network visualisation tool called Gephi. The data used to generate the map was grabbed from the Twitter API using something called an IPython notebook. An IPython notebook is an interactive, browser-based application that allows you to write interactive Python programmmes or construct “bare bones” applications that others can use without needing to learn any programming themselves.

Installing IPython and some of the programming libraries we’re using can sometimes be a bit of a pain. So the way I run the IPython notebook is on what is called a virtual machine. You can think of this as a bit like a “computer inside a computer”. Essentially, the idea is that we install another computer that contains everything we need into a container on our own computer and then work with that through a browser interface.

The virtual machine I use is one that was packaged to support the book Mining the Social Web, 2nd Edition (O’Reilly, 2013) by Matthew Russell. You can find out how to install the virtual machine onto your own computer at Mining the Social Web – Virtual machine Experience.

Having installed the machine, the script I use to harvest the data for the ESP mapping can be found here: Emergent Social Positioning IPython Notebook(preview). The script is inspired by scripts developed by Matthew Russell but with some variations, particularly in the way that data is stored in the virtual machine database.

Download the script into the ipynb directory in the Mining the Social Web directory. To run the script, click on the code cells in turn and hit the “play” button to execute the code. The final code cell contains a line that allows you to enter your own target Twitter account. Double-click on the cell to edit it. When the script has run, a network data file will be written out into the ipynb directory as a .gexf file.

This file can then be imported directly into Gephi, and the network visualised. For a tutorial on visualising networks with Gephi, see First Steps in Identifying Climate Change Denial Networks On Twitter.

While the process may seem to be rather involved – installing the virtual machine, getting it running, getting Twitter API credentials, using the notebook, using Gephi – if you work through the steps methodically, you should be able to get there!

Flattr this!

Tutorial: Data Visualisation for Print

- January 13, 2014 in Data Journalism, HowTo, Visualisation

Let’s say you want to produce a Bubble Chart, Dendrogram or Treemap out of some data you have. You also need to be able to manually edit the output visualization, retouch it and have the ability to export it into larger resolutions for your printed newspaper or posters.

Creating The Charts

We decided to use RAW (http://app.raw.densitydesign.org/) here for two main reasons:

  1. RAW is an online tool that is capable of producing non conventional charts such as Dendrograms, Treemaps, Hexagonal Binnings and Alluvial Diagrams.
  2. The output charts from RAW are easily exported into SVG format. Scalable Vector Graphics (SVG) is an XML-based vector image format. Vector images are composed of a fixed set of shapes, as opposed to raster or bitmap images which are composed of a fixed set of dots. This results in preserving the shapes with high resolution when scaling your image, unlike bitmap images which are usually pixelated when scaled up. We also will see later on that having each shape as a standalone element in the image, gives us more flexibility in editing each shape within our image on its own.

One more reason for using RAW, that might be appealing to the hackers among you, is that it is an open source project, and anyone with programming skills can easily add more layouts and features to it.

In our example here, we are going to use the results of the Egyptian referendum in 2011. We formatted the results and saved them in the following spreadsheet.

Go the the spreadsheet,  and copy the data in the 3rd worksheet. The worksheet is called “Votes, Area and Population”. Now go to RAW and paste the data there.

Once you paste the data you will see a message there that says, “Everything seems fine with your data! Please continue”. We are now sure that everything is fine so far. You may delete any rows that you do not like to have in your final chart. One important note here, you have to make sure that you have a header row in your spreadsheet, i.e. the first row should contain the name of each column of your data.

Now we are all set to scroll down.

After scrolling down, you will be given a drop down list to choose the layout you want from it. We are going to choose “Bubble Chart” here.

Scatter plots are meant to show the relationship between two variable. One variable is represented in the x-axis while the other is displayed in the y-axis.

Bubble charts are similar Scatter plots, yet they can represent one additional variable compared to scatter plots. One variable is represented in the x-axis while the other is displayed in the y-axis, and the third variable is represented by the size of the bubbles in the chart.

Let’s say we want see if there is a relationship between the percentage of the invalid votes and those who voted with no. We want to see if those who are against the referendum were divided between voting with no and invalidating their votes. Thus we are going to drag and drop those two variables into the x and y boxes. We drop the population into the size box so that the sizes of our bubbles are proportional to the population in each governorate. The labels are matched with the governorates, and we divided Egypt into 5 zones and made sure that the bubbles for the governorates within the same zone are given the same colour here.

Now if we scroll down we are going to see our bubble chart ready. We are given the option to change the colours assigned to each zone in Egypt. We also set a maximum radius for our bubbles. Setting the radius to a very small number will convert the bubble chart into a scatter plot. Finally, you can set the width and height of your canvas and decide whether you want to see the horizontal and vertical grid lines there or not.

If you are happy with the final appearance of your chart, then you are now set to export it into a SVG, PNG or JSON file. You are also given the SVG code in case you want to embed the drawing into the your webpage or blog post. Just copy the code shown in the “Embed in HTML” box and paste it into your blog and the chart should appear there.

For our example here, we need to export the chart into a SVG file to be able to deal with it in InkScape later. Thus, we shall now write a proper filename, let’s say, ‘egypt-votes’, in the box underneath the SVG title and click on the download button to save it on our computer.

Preparing the SVG File for Print

We now need to download InkScape from its website (inkscape.org). InkScape is a Free and Open Source tool for dealing with vector graphics. There are plenty of educational screencasts and videos about InkScape here. InkScape is similar to Adobe Illustrator, Corel Draw, Freehand, or Xara X, however the latter are not free softwares. In the end, it is up to you to use whichever vector graphics editor you feel comfortable with.

Now that we have installed InkScape, and saved the chart produced by RAW on our computer into the following file, “egypt-votes.svg”, we can open the file using InkScape.

In InkScape you can select any object within your chart, resize it, change its colour, move it around, edit the text in it, etc. After double clicking on the element you it will get selected, now you can resize it using the 8 arrows shown around it, you can also drag it to a different location in your canvas, and to change its colour, by clicking on any of the colours shown in the pallet below while having your object selected.

The advanced users can also open the the “XML Editor” from the “Edit” menu and edit the SVG elements of the chart like they edit any XML file, as long as they understand the SVG format. You also can add additional elements and text to your chart if you want.

As stated earlier, it is easy to resize the SVG files without sacrificing the quality of the image. In order to use our chart in print, we may want to have it in larger sizes. From the “File”, menu open the “Document Properties”. There, you can pick one of the predefined page-sizes, for example, if you know that you are going to print your chart on an A1 page. Also, you can manually enter a custom size for your chart, then can save your changes now and we are done.

Finally, if you want to send the chart to another user or software that is not capable of dealing with vector images, you can export it into a more common format such as PNG, using the “Export Bitmap” option in the “File” menu.

Flattr this!

Mozilla Popcorn Maker

- December 19, 2013 in Data Journalism, HowTo, Storytelling, Visualisation

As a journalist or blogger, you usually make use of lots of online videos and audio recordings on YouTube, Vimeo or Soundcloud. However, you may need sometimes to embed your own annotations, graphs or maps on top of those videos. Popcorn Maker allows you to add those content into the videos and control where and when they should appear there.

The Time magazine published a video containing 5 inventions that they consider the top 5 inventions of 2013. Let’s take that video as an example here and see how we can embed annotations and other multimedia content in it.

You first need to go to https://popcorn.webmaker.org/, and sign in there. The signup process is easy and you normally do not need to create a password or anything.

After clicking on the sign in button, you will be asked to enter your email address. If you are using an email from one of their Identity Providers, such as Gmail or Yahoo Mail, then you will be taken to your email provider’s login page to login to your email account then you will be redirected back after being authenticated. In case you are using an email provider that is not known to them – e.g. [email protected] – then you will need to create a new password on Mozilla persona.

After logging in, you need to add the url of the YouTube video to the Popcorn maker. Links are added in the “Create new media clip” media section. You can add more than one video or audio links. If you have worked with other video editing tools, such as Windows Movie Maker for example, you will notice many similarities in the process of adding multiple media files and arranging them to work in the order you want. You also can cut and paste parts of the videos you add and reorder them, or use the audio of a SoundCloud file and make it the soundtrack of your YouTube or Vimeo video.

Now after we add the URL of the Time magazine’s video, and clicking on the “Create clip” button, the video will appear in the “My media gallery” section. The media gallery is a sort of repository where you can have all your media files. To start working with the media files you have, you need to drag them into the layers section at the bottom left side of the Popcorn Maker page.

You can think of Popcorn layers as those layers you see in Photoshop, GIMP or in Windows Movie Maker. The horizontal line shows the timeline for which item(s) are to be played at each point in time, while the vertical layers control which items to appear superimposed on each other. For example, if you are having two media items, media1 and media2. If you need them to appear one after the other, you can add them both in the same layer while making sure that the second one starts only when the first one is finished, but if you want the audio of one item to appear along with the video of the other item, then you need to place them in two separate layers and make them start at the same time.

In the image above, we are having two layers, with our video in layer 1, while layer 0 contains a text item.

In order to add the above text item, we need first to click on the “+ Event” tab on the right, then click on text. A new text item will then be added to layer 0, and you will be given some fields to fill for that new item. The most important field of course is the “text” field, where you can write what to be written in your new text area. You can also set the start and end time for its appearance on the screen, or you can do the same thing by dragging and resizing the text item shown in layer 0. You can also change the text’s font, size and colour. In our case here, we added the following text in the beginning of the video, “Time’s Best Inventions of 2013”, then we moved the video item a bit to the right to appear right after the text disappears.

To edit any item you have, just click on it in the layers pane and its settings will be shown in the Events section on the right. To delete an item, just drag it to a new layer, and then delete that layer.

In the minute, 1:25, they speak about the invention of invisible skyscrapers in South Korea. So, let’s show a map with the location of South Korea on top of the video then.

We first need to click on the “+ Event” tab on the right, then click on the “Googlemap” item. This time a map item will be added into a separate layer. We already start the video 4 seconds late after the introductory text. Thus, we need the map to appear at the minute 1:29 (1:25 + 0:04). Let’s type in that value manually, and also let’s keep the map on screen for 10 seconds. In the location field let’s type “South Korea” and set the map type to “Road Map” and the zoom level to 3. We then can change the size and the position of the map item on the screen by dragging and resizing it. We also can double click on the map item to manually change its pan and zoom.

In a similar fashion to adding Text and Google Maps, you can also add images, speaker popups, and  3D models from Sketchfab. You also should find it easy to pause and skip parts of your embedded multimedia content.

When done, you need to give your project a name then click on the save button as shown above.

Finally, here comes the fun part where you can embed the output video along with the interactive multimedia on top of it into your own blog or journal. To do so, you have to click on “Project”, then copy and paste the HTML code shown in the “Embed” tab into your own blog or web page.

Flattr this!

The World Tweets Nelson Mandela’s Death

- December 10, 2013 in Data Stories, Mapping, Storytelling, Visualisation

The World Tweets Nelson Mandela’s DeathClick here to see the interactive version of the map above 

Data visualization is awesome! However, it conveys its goal when it tells a story. This weekend, Mandela’s death dominated the Twitter world and hashtags mentioning Mandela were trending worldwide. I decided to design a map that would show how people around the world tweeted the death of Nelson Mandela. First, I started collecting tweets associated with #RIPNelsonMandela using ScraperWiki. I collected approximately 250,000 tweets during the death day of Mandela. You can check this great recipe at school of data blog on how to extract and refine tweets.

scraperwiki

After the step above, I refined the collected tweets and uploaded the data into CartoDB. It is one of my favorite open source mapping tools and I will make sure to write a CartoDB tutorial in future posts. I used the Bubble or proportional symbol map which is usually better for displaying raw data. Different areas had different tweeting rates and this reflected how different countries reacted. Countries like South Africa, UK, Spain, and Indonesia had higher tweeting rates. The diameter of the circles represents the number of retweets. With respect to colors, the darker they appeared, the higher the intensity of tweets is.

That’s not the whole story! Basically, it is easy to notice that some areas have high tweeting rates such as Indonesia and Spain. After researching about this topic, it was quite interesting to know that Mandela had a unique connection with Spain, one forged during two major sporting events. In 2010, Nelson Mandela was present in the stadium when Spain’s international football team won their first ever World Cup Football trophy as well. Moreover, for Indonesians, Mandela has always been a source of joy and pride, especially as he was fond of batik and often wore it, even in his international appearances.

Nonetheless, it was evident that interesting insights can be explored and such data visualizations can help us show the big picture. It also highlight events and facts that we are not aware of in the traditional context.

Flattr this!

Visiting Electionland

- November 6, 2013 in Data Stories, HowTo, R, Visualisation


After the German elections, data visualization genius Moritz Stefaner created a map of election districts, grouping them not by geography but by election patterns. This visualisation impressively showed a still-existing divide in Germany. It is a fascinating alternative way to look at elections. On his blog, he explains how he did this visualization. I decided to reconstruct it using Austrian election data (and possibly more countries coming).

Austria recently published the last election’s data as open data, so I took the published dataset and cleaned it up by removing summaries and introducing names for the different states (yes, this is a federal state). Then I looked at how to get the results mapped out nicely.

In his blog post, Moritz explains that he used Z-Scores to normalize data and then used a technique called Multidimensional Scaling (MDS) to map the distances calculated between points into 2-dimensional space. So I checked out Multidimensional Scaling, starting on Wikipedia, where I discovered that it’s linear algebra way over my head (yes, I have to finish Strang’s course on linear Algebra at some point). The Wikipedia article fortunately mentions a R command cmdscale that does multidimensional scaling for you. Lucky me! So I wrote a quick R script:

First I needed to normalize the data. Normalization becomes necessary when the raw data itself is very hard to compare. In election data, some voting stations will have a hundred voters, some a thousand; if you just take the raw vote-count, this doesn’t work well to compare, as the numbers are all over the place, so usually it’s broken down into percentages. But even then, if you want to value all parties equally (and have smaller parties influence the graph as much as larger parties), you’ll need to apply a formula to make the numbers comparable.

I decided to use Z-Scores as used by Moritz. The Z-Score is a very simple normalization score that takes two things, the mean and the standard deviation, and tells you how many standard deviations a measurement is above the average measurement. This is fantastic to use in high-throughput testing (the biomed nerd in me shines through here) or to figure out which districts voted more than usual for a specific party.

After normalization, you can perform the magic. I used dist to calculate the distances between districts (by default, this uses Euclidean distance) and then used cmdscale to do the scaling. Works perfectly!

With newly created X and Y coordinates, the only thing left is visualization—a feat I accomplished using D3 (look at the code—danger, there be dragons). I chose a simpler way of visualizing the data: bubbles the size of voters in the district, the color of the strongest party.

Wahlland visualization of Austrian general Elections 2013
(Interactive version)

You can see: Austria is less divided than Germany. However, if you know the country, you’ll find curious things: Vienna and the very west of Austria, though geographically separated, vote very similarly. So while I moved across the country to study when I was 18, I didn’t move all that much politically. Maybe this is why Vienna felt so comfortable back then—but this is another story to be explored another time.

Flattr this!

Pie and Donut Charts in D3.js

- October 1, 2013 in Visualisation


D3.js is a JavaScript library that is widely used in data visualisation and animation. The power of d3.js and its flexibility, comes at the expense of its steep learning curve. There are some libraries built on top of it that provide numerous off-the-shelf charts in order to make the users’ life easier, however, learning to work with d3.js is essential sometimes, especially when you need to create sophisticated and custom visualisations.

If you are not familiar with d3.js, you can read this introduction. In brief, just like jQuery and other DOM manipulation frameworks, it allows you to dynamically manipulate the properties and attributes of your HTML document elements. Nevertheless, it doesn’t stop here. Its power comes from two additional functionality. It can also create and manipulate SVG elements, and it can also bind the DOM or SVG elements to arrays of data, so that any changes in that data will be reflected on those elements they are binded to. There are numerous SVG shapes, such as circles, rectangles, paths and texts. Those shapes serve as the building blocks of your visualisations. For example, a bar chart is composed of multiple rectangles. while a scatter plot is made of circles scattered in different parts of you drawing area. You may also want to see this interactive tutorial about creating and manipulation SVG elements, as well as binding them to data arrays.

In this tutorial, we are going to show how to create pie charts and donut charts, which are very similar to pie charts with only one difference, their centre is hollow. Those two charts are built using SVG paths. The SVG path is a more advanced shape compared to circles and rectangles, since it uses path commands to create any arbitrary shape we want. So, as you can see in the above figure, a donut chart is composed of multiple arc-like paths, with a different fill colour. Fortunately, d3.js provides a helper functions to draw arcs. Arcs are drawn using 4 main parameters: startAngle, endAngle, innerRadius and outerRadius. The angles are given in radians rather than degrees, so a full circle is 2 π instead of 360 degrees. Bear with me for now, and I will show you a way to enter angles using more meaningful ways later on.

To draw an arc, let’s first add the following SVG tag in our html documents:

<svg id="svg_donut" width="600" height="400"></svg>

Now, to draw an arc that goes from 0 to ¾ of a full rotation, with inner radius of 50 pixels and outer radius of 100 pixels, we need to type the following JavaScript code.

var vis = d3.select("#svg_donut");
var arc = d3.svg.arc()
.innerRadius(50)
.outerRadius(100)
.startAngle(0)
.endAngle(1.5*Math.PI);

vis.append("path")
.attr("d", arc)
.attr("transform", "translate(300,200)");

In the above code, we first select our SVG element using its identifier, “#svg_donut”. We save our selection into a variable called “vis”. d3.svg.arc() is the d3.js helper function that we use rather than the SVG path commands. We give it our previously mentioned 4 parameters and save the result into a variable called “arc”. Now, to actually create the path and append it to our SVG element, we use vis.append(“path”), then assign the “arc” to its “d” attribute. You may consider the “d” attribute as an alternative to the SVG path command.

By default, things are drawn in the top left corner of the SVG element. To move the arc to the center of our SVG, we translate it to (300,200), which our width/2 and height/2 respectively.

The output will look as follows:

Dealing with radian angles is boring. Fortunately, d3.js provides us with another helper functions called scales. It basically helps us mapping one scale, to another. Let’s say, rather than having the full rotation spanning from 0 to 2 π, we want it to be from 0 to 100. All we need to do is to write the following code:

var myScale = d3.scale.linear().domain([0, 100]).range([0, 2 * Math.PI]);

From now on, myScale(0) = 0, myScale(100) = 2 π, myScale(75) = 1.5 π, etc. Thus, the above code can be written as follows now.

var vis = d3.select("#svg_donut");
var myScale = d3.scale.linear().domain([0, 100]).range([0, 2 * Math.PI]);
var arc = d3.svg.arc()
.innerRadius(50)
.outerRadius(100)
.startAngle(myScale(0))
.endAngle(myScale(75));

vis.append("path")
.attr("d", arc)
.attr("transform", "translate(300,200)");

So far, we learnt how to create an arc. Pie or donut charts are composed of multiple arcs the angle of each of them represents the value of one item of our data to the overall data values. In other words if we have 3 mobile brands, A, B and C, where A has 50% of the market share, while B and C, have 25% each. Then we represent them in our charts as 3 arcs with angles of π, π/2 and π/2 respectively. To implement this using the d3.js way, you need to have an array of data and bind it to arcs. As you have seen in the aforementioned tutorial, SVG elements can be created on the fly to match the data they are binded to.

var cScale = d3.scale.linear().domain([0, 100]).range([0, 2 * Math.PI]);

data = [[0,50,"#AA8888"], [50,75,"#88BB88"], [75,100,"#8888CC"]]

var vis = d3.select("#svg_donut");

var arc = d3.svg.arc()
.innerRadius(50)
.outerRadius(100)
.startAngle(function(d){return cScale(d[0]);})
.endAngle(function(d){return cScale(d[1]);});

vis.selectAll("path")
.data(data)
.enter()
.append("path")
.attr("d", arc)
.style("fill", function(d){return d[2];})
.attr("transform", "translate(300,200)");

The data array is composed of 3 data items, each of them is given as an array of 3 values. The first item goes from 0 to 50% of the donut with a background colour of “#AA8888”, the starting angle of the second item should comes right after the first, i.e. 50%, and it goes to 75%, with a background colour of “#88BB88. Similarly, the third item goes from 75% to 100%, with a background colour of “#8888CC”.

To append arcs dynamically based on our data, we select path, bind our data to the selections then append new paths accordingly:

vis.selectAll("path").data(data).enter().

The “startAngle”, “endAngle” and “fill” are grabbed from the data items as shown in red.

The resulting donut looks as follows:

The exact same code can be used to create a pie chart, the only difference is that the value given to the innerRadius() should be set to 0. The resulting pie chart can also be seen below:

Between you and me, there are existing libraries built on top of d3.js than can create pie charts for you with less code. So, why do you need to learn all this? The idea here is to learn the d3.js internal, so you can tweak the above code to suite your needs. An off-the-shelf library can give you a pie chart, or a donut chart. But what about the following charts?

Flattr this!

Seeing is believing – measuring is evidence.

- September 9, 2013 in Data Journalism, Visualisation


graphic

Recently an Austrian newspaper published the graph above. It was part of an interesting story on how people viewed the different political parties. One thing is notable: The first row and the fourth row are nearly similar – except the fourth row has much more on the left side (distrust) then the first. Let’s put them together to see this:

together

Now check the numbers – telling the percentage of people (dis)-trusting – note how the bar on the fourth (that says 31%) is nearly as long as the one next to it saying 40%? Let’s look at it with a line helping us:

graphic-line

Look at this: Someone made a mistake (or intended to show a difference bigger than it really was). This is pretty clear cut and several readers noted this in the comments below the article.

How much is it off?

Let’s find out how much it is wrong. Going back from graphs to numbers is challenging and a tricky process – I use a tool called imagej made to measure graphics (you can also do this using your graphics manipulation program). I measure the length of all the bars. Based on this and the value we can calculate whether the graph is well made. Two things are important to us: the start point (y) and the scale (x). The scale tells us how many pixels were used per unit, the start point at which value the graph started.

This gives the following formula for any bar: L=y+x*V (L is the length in pixels, V the value of the data-point). Since we do have two unknowns we need a second value/length pair to do the calculation L1=y+x*V1 – transforming this tells us x=(L-L1)/(V-V1) and y=L-x*V. This way we can calculate both scale and starting point. I did this in a spreadsheet for all the bars next to each other – since your measuring will be slightly inaccurate x and y will vary. I simply took the median of all x and y as their final values. Now we can calculate the expected length for each value point and the difference it has to the measured length: Most of the bars are about the right size (I do think this is measurement mistakes) – however the bar in question is 13-14 pixels too long. Gotcha sloppy data journalist.

Want more: @adrianshort did this for uk election advertisements

Flattr this!